| __timestamp | The Boeing Company | XPO Logistics, Inc. |
|---|---|---|
| Wednesday, January 1, 2014 | 90762000000 | 2356600000 |
| Thursday, January 1, 2015 | 96114000000 | 7623200000 |
| Friday, January 1, 2016 | 94571000000 | 14619400000 |
| Sunday, January 1, 2017 | 93392000000 | 15380800000 |
| Monday, January 1, 2018 | 101127000000 | 17279000000 |
| Tuesday, January 1, 2019 | 76559000000 | 16648000000 |
| Wednesday, January 1, 2020 | 58158000000 | 16252000000 |
| Friday, January 1, 2021 | 62286000000 | 12806000000 |
| Saturday, January 1, 2022 | 66608000000 | 7718000000 |
| Sunday, January 1, 2023 | 77794000000 | 7744000000 |
| Monday, January 1, 2024 | 66517000000 | 8072000000 |
Unlocking the unknown
In the ever-evolving landscape of American industry, Boeing and XPO Logistics stand as titans in their respective fields. From 2014 to 2023, Boeing's revenue trajectory reveals a rollercoaster ride, peaking in 2018 with a 26% increase from 2014, before facing a downturn in 2020, likely due to global disruptions. Meanwhile, XPO Logistics showcased a remarkable growth story, with revenue surging over 600% from 2014 to 2018, reflecting its aggressive expansion strategy.
However, the pandemic years saw both companies grappling with challenges. Boeing's revenue in 2020 plummeted by 42% from its 2018 high, while XPO's revenue also saw a decline, albeit less severe. By 2023, Boeing showed signs of recovery with a 34% increase from its 2020 low, whereas XPO's revenue remained relatively stable, indicating resilience in a volatile market. Missing data for 2024 suggests ongoing uncertainties.
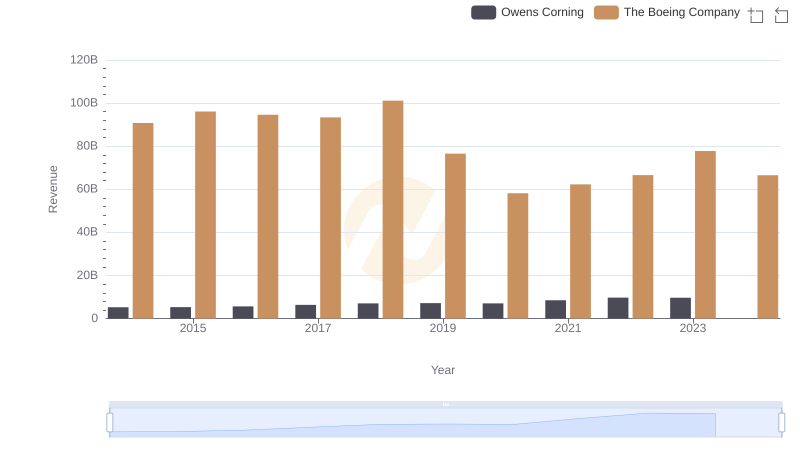
The Boeing Company and Owens Corning: A Comprehensive Revenue Analysis
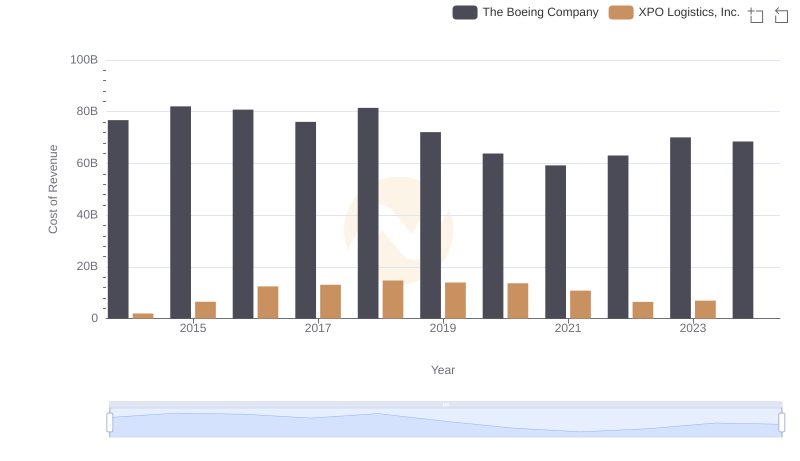
Analyzing Cost of Revenue: The Boeing Company and XPO Logistics, Inc.
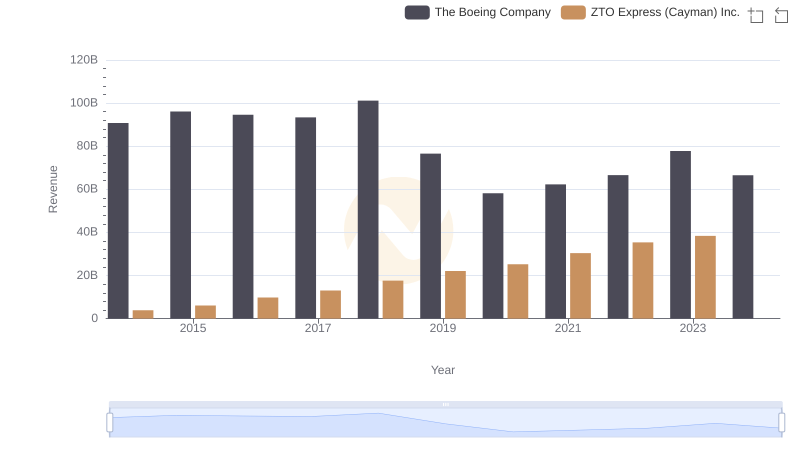
The Boeing Company or ZTO Express (Cayman) Inc.: Who Leads in Yearly Revenue?
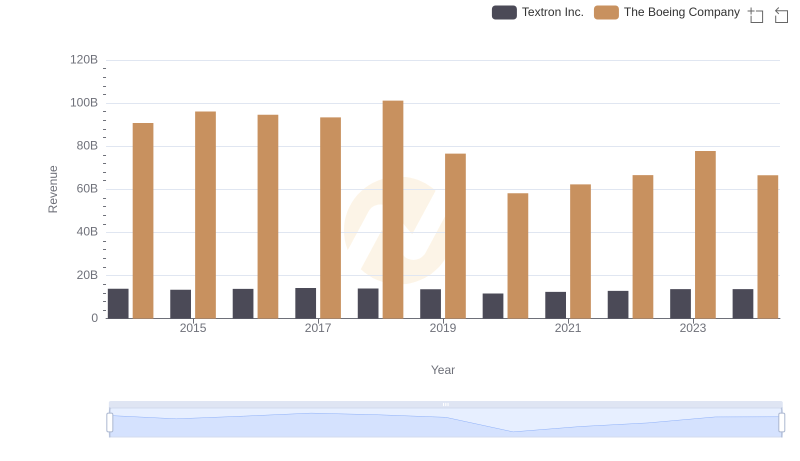
Annual Revenue Comparison: The Boeing Company vs Textron Inc.

Operational Costs Compared: SG&A Analysis of The Boeing Company and XPO Logistics, Inc.