| __timestamp | IDEX Corporation | The Boeing Company |
|---|---|---|
| Wednesday, January 1, 2014 | 504419000 | 3767000000 |
| Thursday, January 1, 2015 | 479408000 | 3525000000 |
| Friday, January 1, 2016 | 498994000 | 3616000000 |
| Sunday, January 1, 2017 | 524940000 | 4094000000 |
| Monday, January 1, 2018 | 536724000 | 4567000000 |
| Tuesday, January 1, 2019 | 524987000 | 3909000000 |
| Wednesday, January 1, 2020 | 494935000 | 4817000000 |
| Friday, January 1, 2021 | 578200000 | 4157000000 |
| Saturday, January 1, 2022 | 652700000 | 4187000000 |
| Sunday, January 1, 2023 | 703500000 | 5168000000 |
| Monday, January 1, 2024 | 758700000 | 5021000000 |
Cracking the code
In the world of corporate finance, understanding a company's spending patterns can reveal much about its strategic priorities. Over the past decade, The Boeing Company and IDEX Corporation have demonstrated distinct approaches to their Selling, General, and Administrative (SG&A) expenses. From 2014 to 2023, Boeing's SG&A expenses have consistently been higher, peaking in 2023 with a 37% increase from 2015. This reflects Boeing's expansive operations and global reach. In contrast, IDEX Corporation, while smaller in scale, has shown a steady increase in SG&A spending, culminating in a 47% rise over the same period. This growth suggests a strategic investment in administrative capabilities and market expansion. Notably, 2024 data for IDEX is missing, indicating potential reporting delays or strategic shifts. These insights underscore the importance of SG&A analysis in evaluating corporate strategies and market positioning.
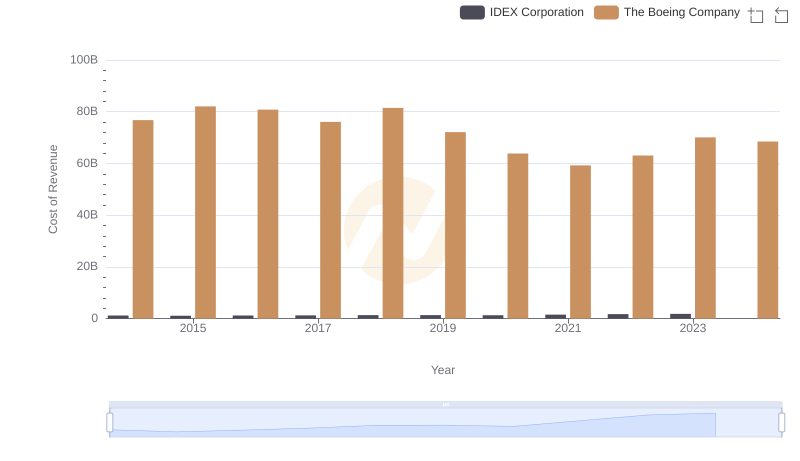
Cost of Revenue Comparison: The Boeing Company vs IDEX Corporation
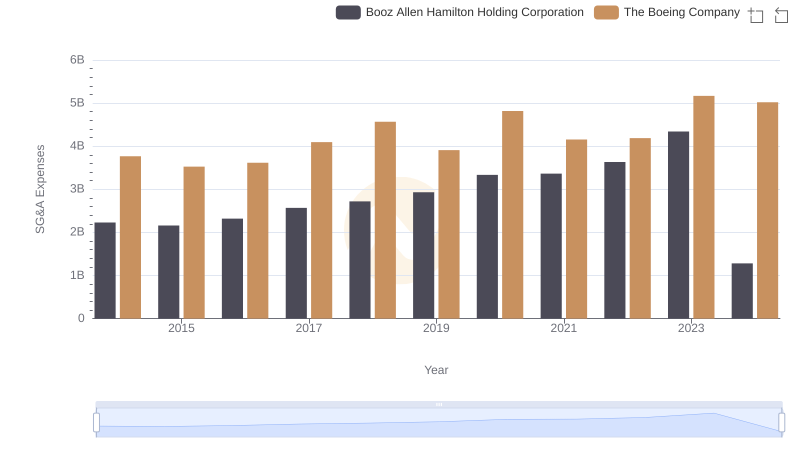
Operational Costs Compared: SG&A Analysis of The Boeing Company and Booz Allen Hamilton Holding Corporation
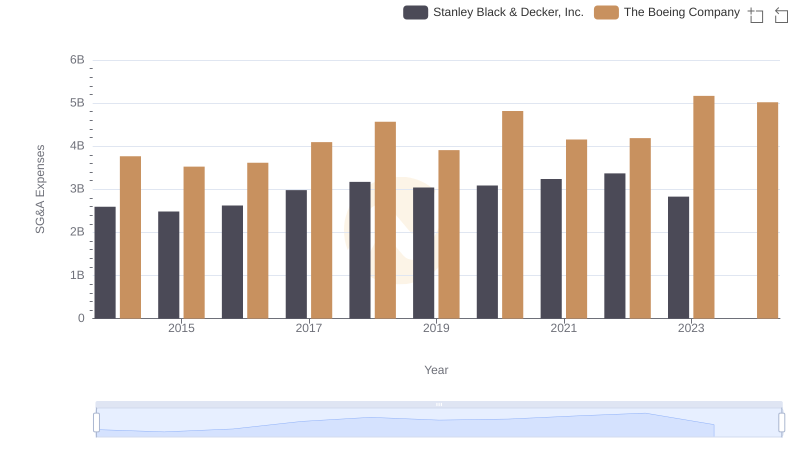
Selling, General, and Administrative Costs: The Boeing Company vs Stanley Black & Decker, Inc.
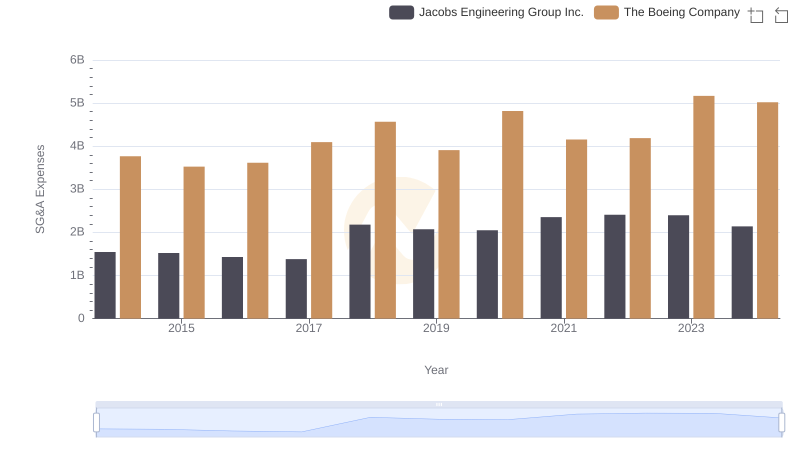
Breaking Down SG&A Expenses: The Boeing Company vs Jacobs Engineering Group Inc.
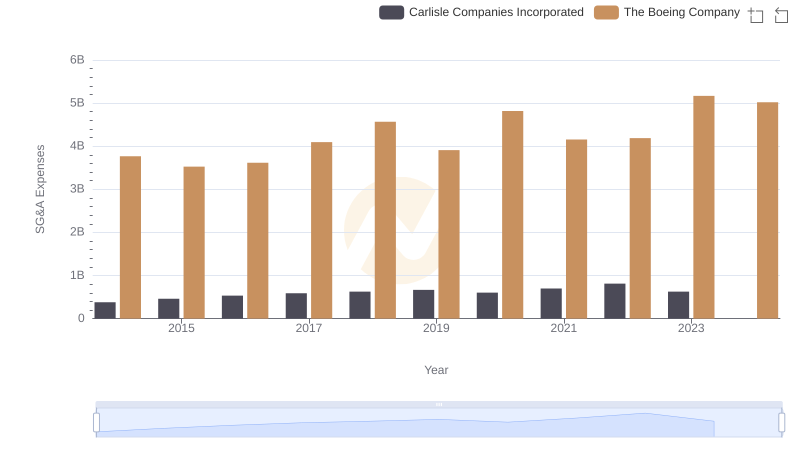
Who Optimizes SG&A Costs Better? The Boeing Company or Carlisle Companies Incorporated
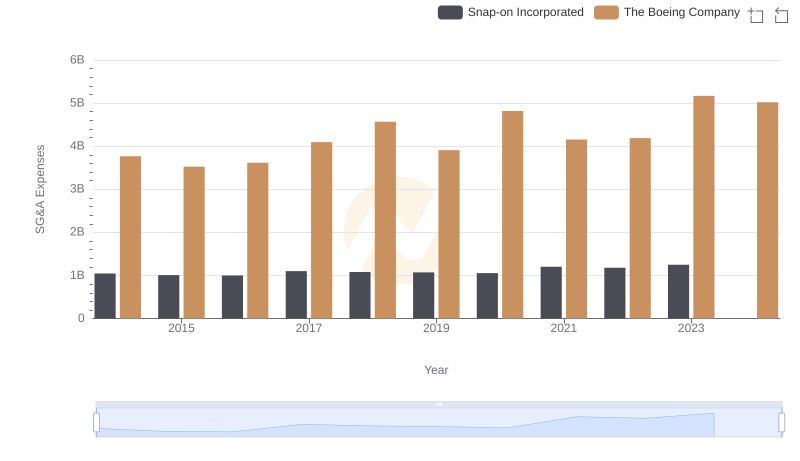
The Boeing Company or Snap-on Incorporated: Who Manages SG&A Costs Better?

Operational Costs Compared: SG&A Analysis of The Boeing Company and XPO Logistics, Inc.
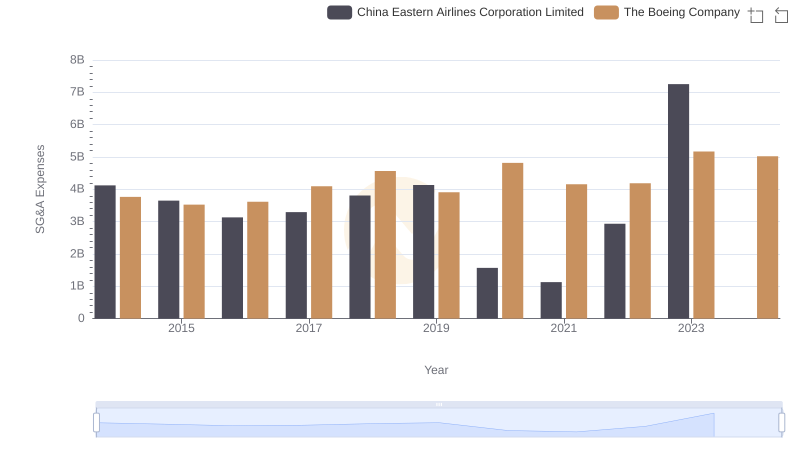
Who Optimizes SG&A Costs Better? The Boeing Company or China Eastern Airlines Corporation Limited