| __timestamp | The Boeing Company | XPO Logistics, Inc. |
|---|---|---|
| Wednesday, January 1, 2014 | 76752000000 | 1975000000 |
| Thursday, January 1, 2015 | 82088000000 | 6538400000 |
| Friday, January 1, 2016 | 80790000000 | 12480100000 |
| Sunday, January 1, 2017 | 76066000000 | 13101100000 |
| Monday, January 1, 2018 | 81490000000 | 14738000000 |
| Tuesday, January 1, 2019 | 72093000000 | 13982000000 |
| Wednesday, January 1, 2020 | 63843000000 | 13689000000 |
| Friday, January 1, 2021 | 59237000000 | 10812000000 |
| Saturday, January 1, 2022 | 63078000000 | 6491000000 |
| Sunday, January 1, 2023 | 70070000000 | 6974000000 |
| Monday, January 1, 2024 | 68508000000 | 7157000000 |
Unleashing insights
In the ever-evolving landscape of the aerospace and logistics industries, understanding cost dynamics is crucial. From 2014 to 2023, The Boeing Company and XPO Logistics, Inc. have shown distinct trends in their cost of revenue. Boeing's cost of revenue peaked in 2015, reaching approximately 82 billion, before experiencing a gradual decline, hitting a low in 2021. This represents a 28% decrease over the period, reflecting the challenges faced by the aerospace giant, including market fluctuations and global events.
Conversely, XPO Logistics saw a dramatic rise in its cost of revenue, increasing by over 600% from 2014 to 2018, before stabilizing. This growth underscores XPO's aggressive expansion and adaptation strategies in the logistics sector. However, data for 2024 is missing, leaving room for speculation on future trends. These insights provide a window into the strategic maneuvers of two industry leaders.
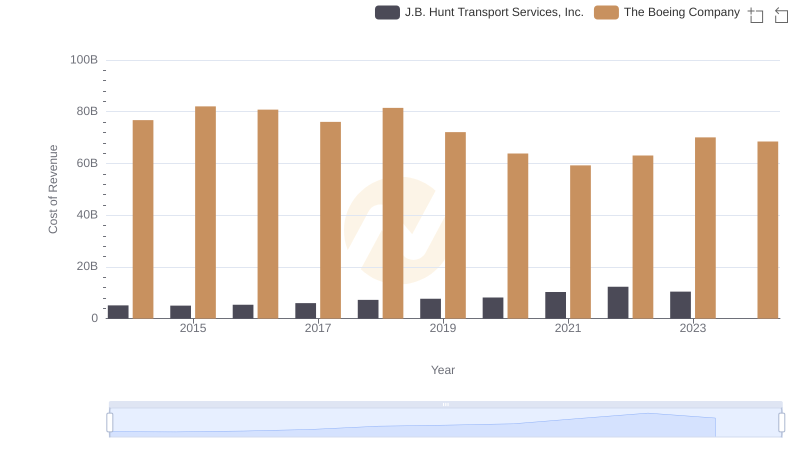
Comparing Cost of Revenue Efficiency: The Boeing Company vs J.B. Hunt Transport Services, Inc.

The Boeing Company vs XPO Logistics, Inc.: Examining Key Revenue Metrics
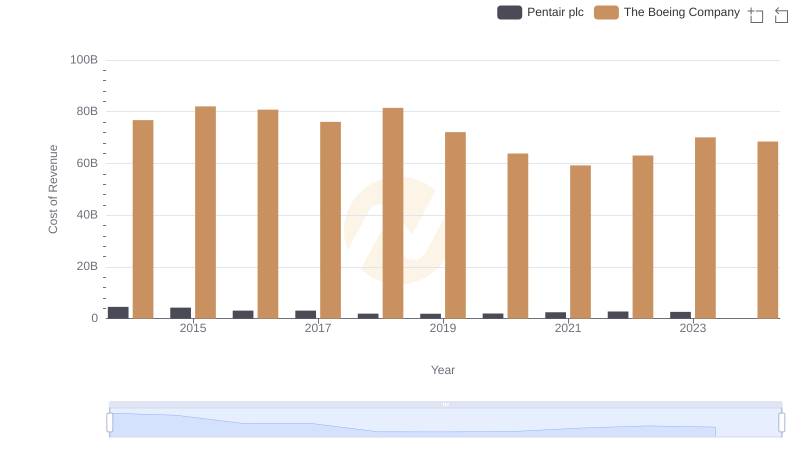
Comparing Cost of Revenue Efficiency: The Boeing Company vs Pentair plc
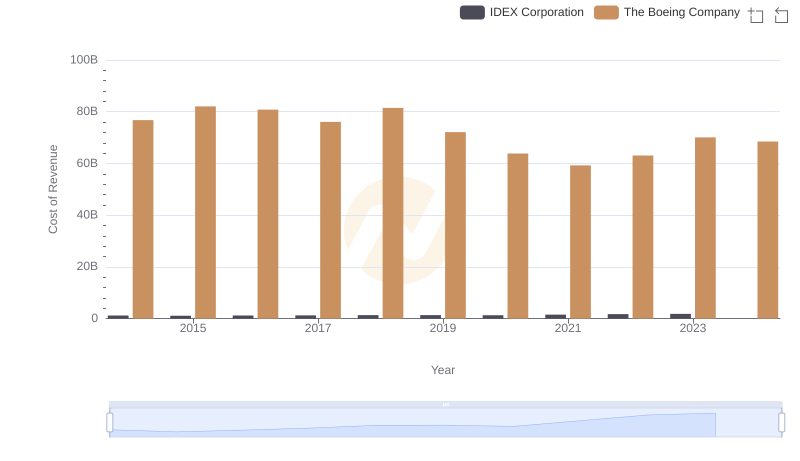
Cost of Revenue Comparison: The Boeing Company vs IDEX Corporation
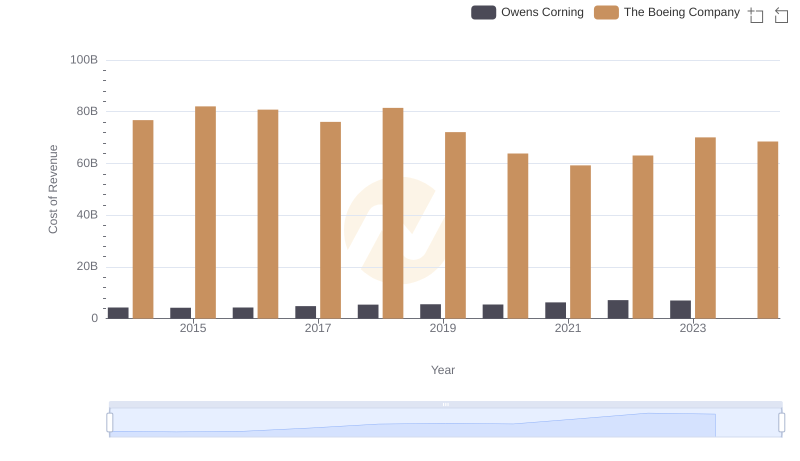
Cost of Revenue: Key Insights for The Boeing Company and Owens Corning
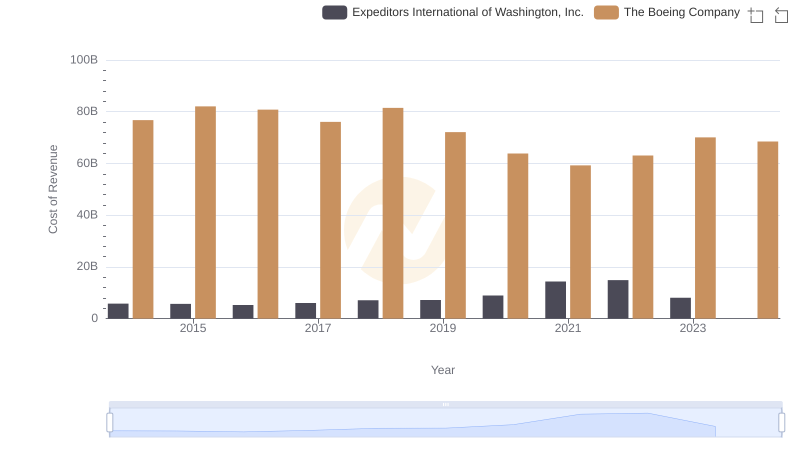
Cost of Revenue Comparison: The Boeing Company vs Expeditors International of Washington, Inc.

Operational Costs Compared: SG&A Analysis of The Boeing Company and XPO Logistics, Inc.