| __timestamp | Jacobs Engineering Group Inc. | The Boeing Company |
|---|---|---|
| Wednesday, January 1, 2014 | 1545716000 | 3767000000 |
| Thursday, January 1, 2015 | 1522811000 | 3525000000 |
| Friday, January 1, 2016 | 1429233000 | 3616000000 |
| Sunday, January 1, 2017 | 1379983000 | 4094000000 |
| Monday, January 1, 2018 | 2180399000 | 4567000000 |
| Tuesday, January 1, 2019 | 2072177000 | 3909000000 |
| Wednesday, January 1, 2020 | 2050695000 | 4817000000 |
| Friday, January 1, 2021 | 2355683000 | 4157000000 |
| Saturday, January 1, 2022 | 2409190000 | 4187000000 |
| Sunday, January 1, 2023 | 2398078000 | 5168000000 |
| Monday, January 1, 2024 | 2140320000 | 5021000000 |
Unveiling the hidden dimensions of data
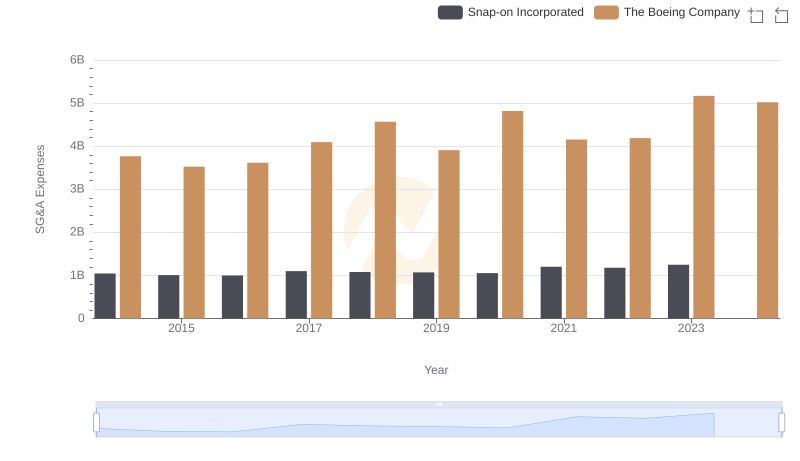
In the world of aerospace and engineering, two titans stand out: The Boeing Company and Jacobs Engineering Group Inc. Over the past decade, these companies have showcased contrasting trends in their Selling, General, and Administrative (SG&A) expenses. From 2014 to 2023, Boeing's SG&A expenses have consistently been more than double those of Jacobs, peaking in 2023 with a 38% increase from 2014. Meanwhile, Jacobs Engineering has seen a steady rise, with a notable 74% increase in SG&A expenses from 2017 to 2023. This divergence highlights Boeing's expansive operational scale compared to Jacobs' more streamlined approach. As we look to the future, these trends may offer insights into each company's strategic priorities and market positioning. Understanding these financial dynamics is crucial for investors and industry analysts alike, as they reflect broader economic and competitive forces at play.
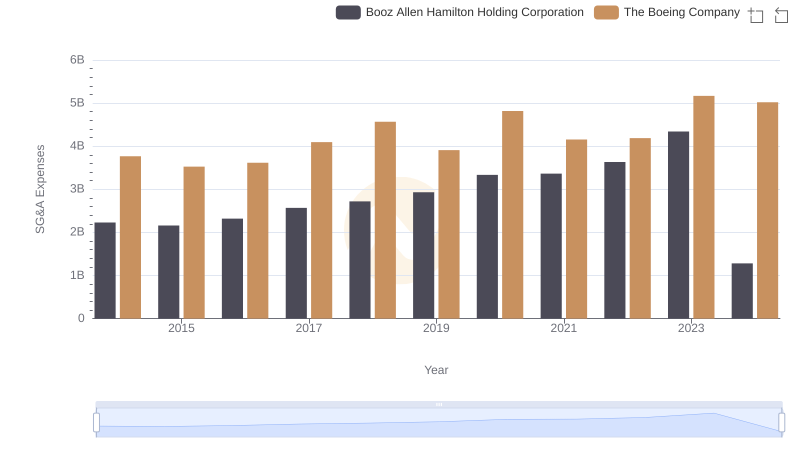
Operational Costs Compared: SG&A Analysis of The Boeing Company and Booz Allen Hamilton Holding Corporation
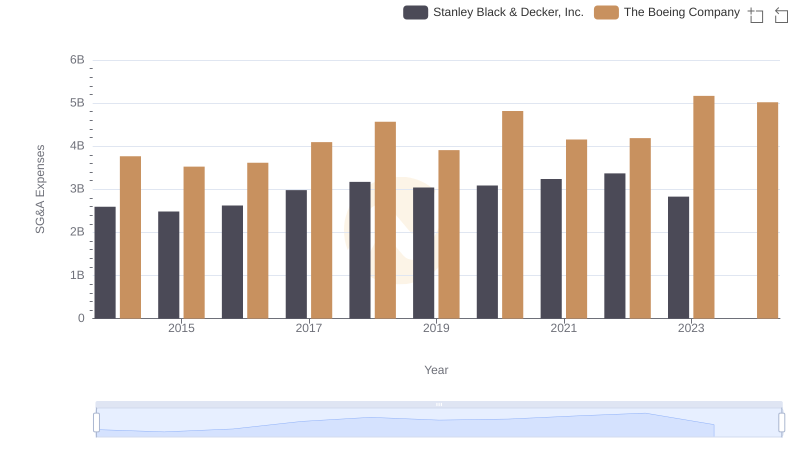
Selling, General, and Administrative Costs: The Boeing Company vs Stanley Black & Decker, Inc.
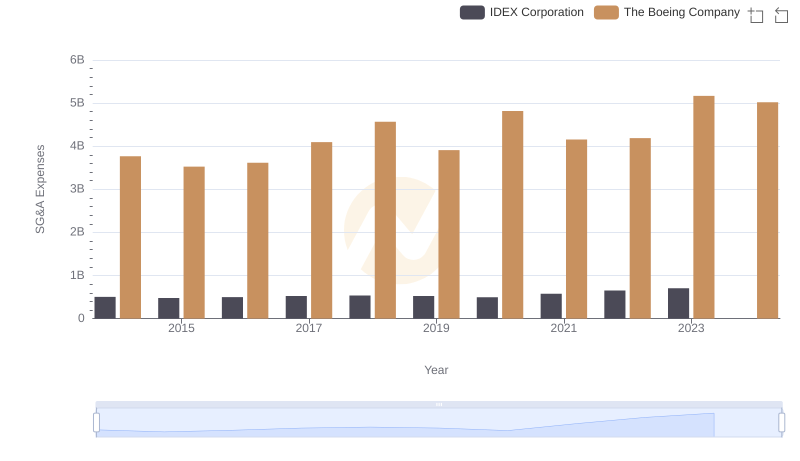
The Boeing Company and IDEX Corporation: SG&A Spending Patterns Compared
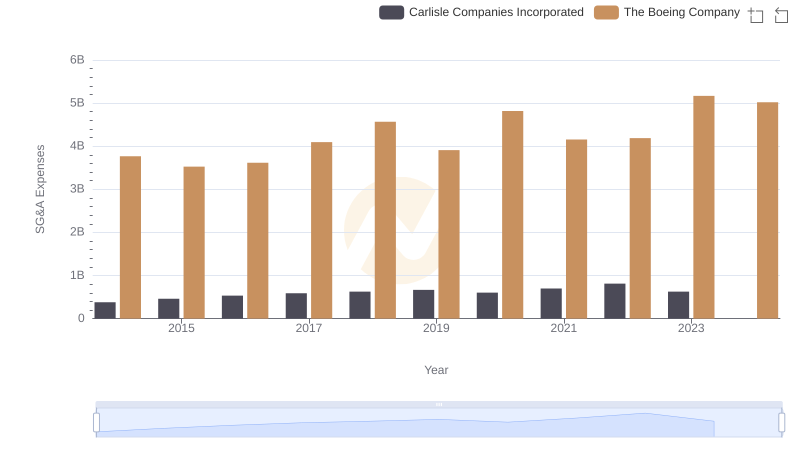
Who Optimizes SG&A Costs Better? The Boeing Company or Carlisle Companies Incorporated
The Boeing Company or Snap-on Incorporated: Who Manages SG&A Costs Better?

Operational Costs Compared: SG&A Analysis of The Boeing Company and XPO Logistics, Inc.