| __timestamp | Johnson Controls International plc | The Boeing Company |
|---|---|---|
| Wednesday, January 1, 2014 | 4308000000 | 3767000000 |
| Thursday, January 1, 2015 | 3986000000 | 3525000000 |
| Friday, January 1, 2016 | 4190000000 | 3616000000 |
| Sunday, January 1, 2017 | 6158000000 | 4094000000 |
| Monday, January 1, 2018 | 6010000000 | 4567000000 |
| Tuesday, January 1, 2019 | 6244000000 | 3909000000 |
| Wednesday, January 1, 2020 | 5665000000 | 4817000000 |
| Friday, January 1, 2021 | 5258000000 | 4157000000 |
| Saturday, January 1, 2022 | 5945000000 | 4187000000 |
| Sunday, January 1, 2023 | 6181000000 | 5168000000 |
| Monday, January 1, 2024 | 5661000000 | 5021000000 |
Igniting the spark of knowledge
In the ever-evolving landscape of corporate finance, understanding operational costs is crucial. Over the past decade, from 2014 to 2024, Johnson Controls International plc and The Boeing Company have showcased distinct trends in their Selling, General, and Administrative (SG&A) expenses. Johnson Controls consistently outpaced Boeing, with an average SG&A expense of approximately 5.4 billion USD annually, compared to Boeing's 4.3 billion USD.
These insights highlight the strategic financial maneuvers of these industry giants, reflecting their adaptive strategies in a dynamic market.
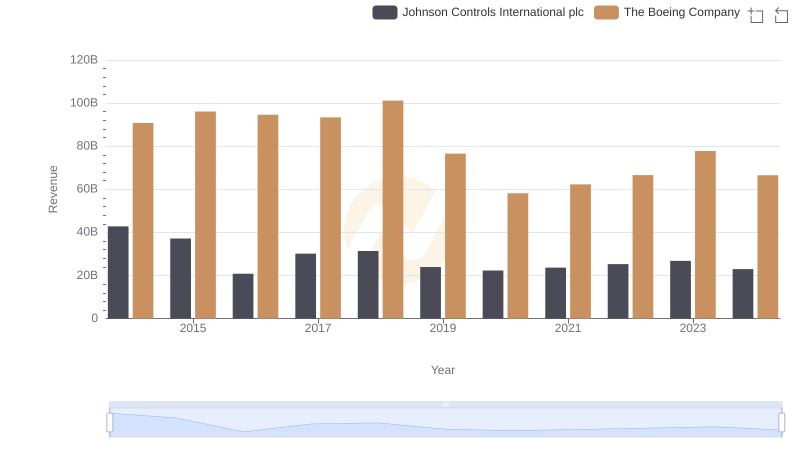
The Boeing Company vs Johnson Controls International plc: Examining Key Revenue Metrics
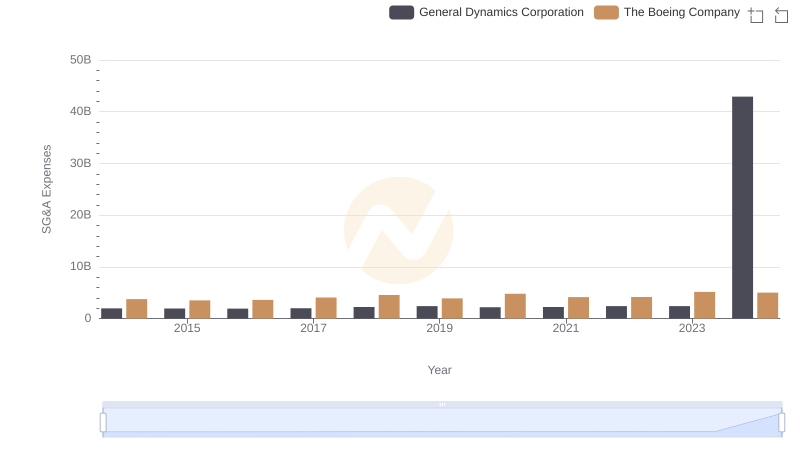
Operational Costs Compared: SG&A Analysis of The Boeing Company and General Dynamics Corporation
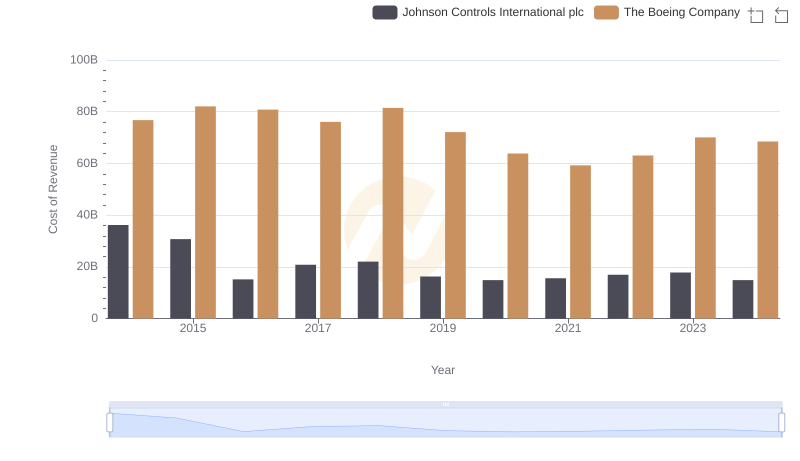
Analyzing Cost of Revenue: The Boeing Company and Johnson Controls International plc
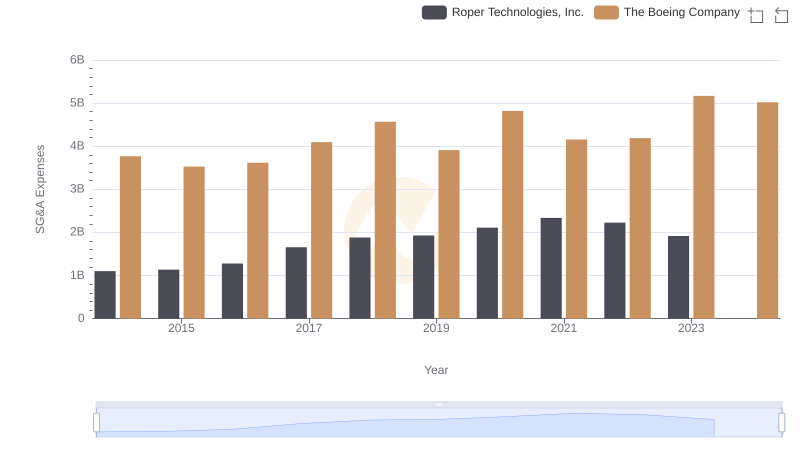
Cost Management Insights: SG&A Expenses for The Boeing Company and Roper Technologies, Inc.
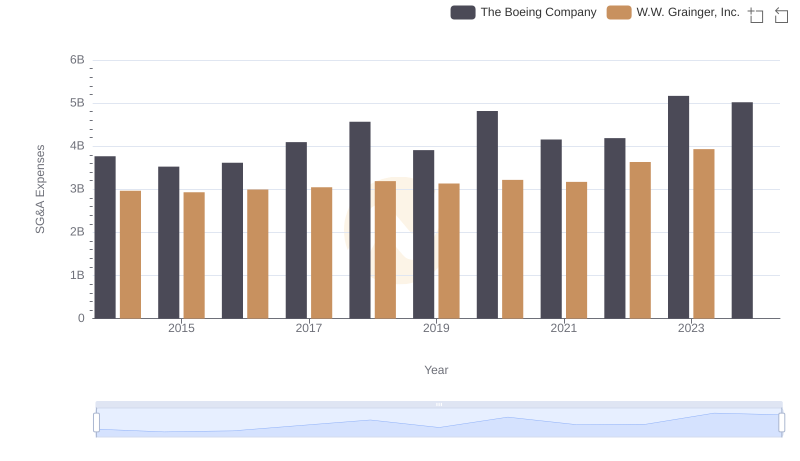
Selling, General, and Administrative Costs: The Boeing Company vs W.W. Grainger, Inc.
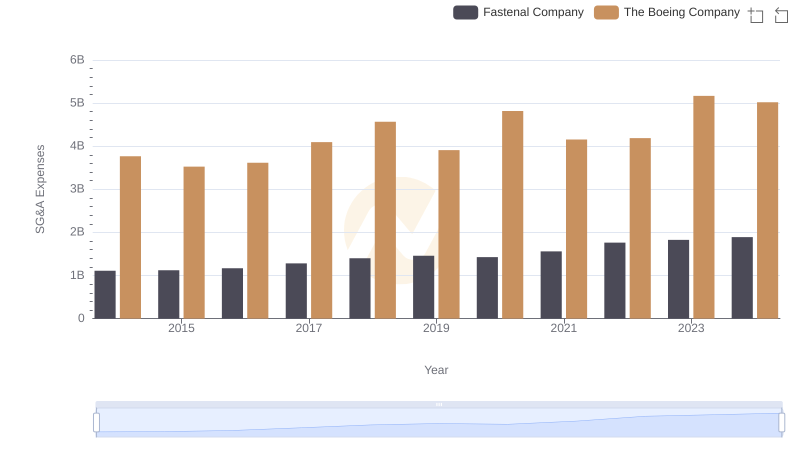
Who Optimizes SG&A Costs Better? The Boeing Company or Fastenal Company
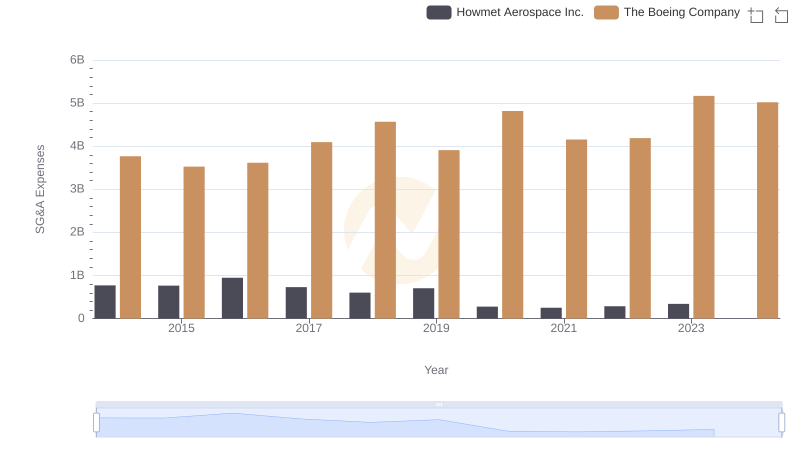
The Boeing Company or Howmet Aerospace Inc.: Who Manages SG&A Costs Better?
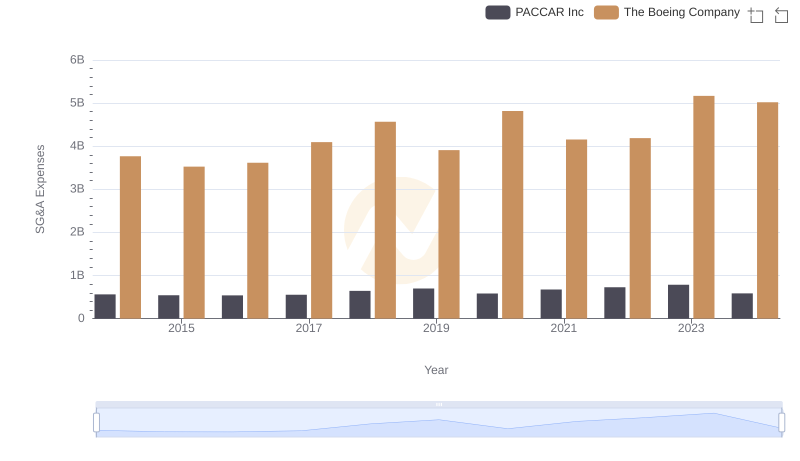
Who Optimizes SG&A Costs Better? The Boeing Company or PACCAR Inc
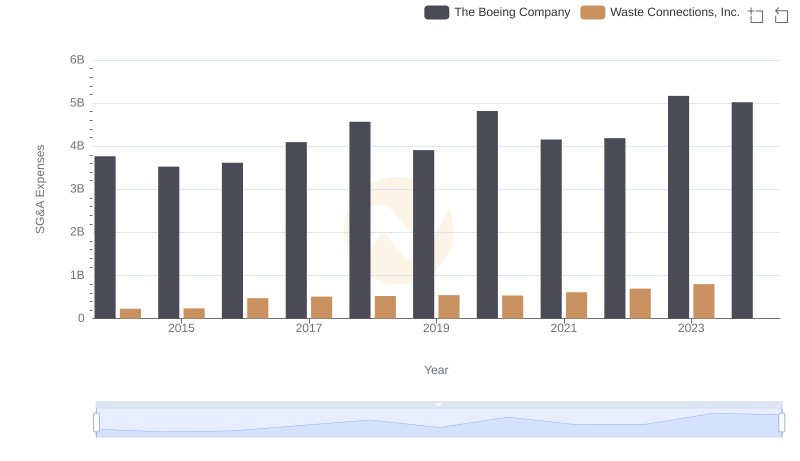
Who Optimizes SG&A Costs Better? The Boeing Company or Waste Connections, Inc.