| __timestamp | Johnson Controls International plc | The Boeing Company |
|---|---|---|
| Wednesday, January 1, 2014 | 42828000000 | 90762000000 |
| Thursday, January 1, 2015 | 37179000000 | 96114000000 |
| Friday, January 1, 2016 | 20837000000 | 94571000000 |
| Sunday, January 1, 2017 | 30172000000 | 93392000000 |
| Monday, January 1, 2018 | 31400000000 | 101127000000 |
| Tuesday, January 1, 2019 | 23968000000 | 76559000000 |
| Wednesday, January 1, 2020 | 22317000000 | 58158000000 |
| Friday, January 1, 2021 | 23668000000 | 62286000000 |
| Saturday, January 1, 2022 | 25299000000 | 66608000000 |
| Sunday, January 1, 2023 | 26793000000 | 77794000000 |
| Monday, January 1, 2024 | 22952000000 | 66517000000 |
Unleashing the power of data
In the ever-evolving landscape of global industry, The Boeing Company and Johnson Controls International plc stand as titans in their respective fields. From 2014 to 2024, these companies have navigated the turbulent waters of economic shifts and market demands. Boeing, a leader in aerospace, saw its revenue peak in 2018, reaching nearly 101 billion dollars, before experiencing a decline, notably during the pandemic in 2020, when revenues dropped by approximately 42% from their peak. Meanwhile, Johnson Controls, a key player in building technologies, experienced a more stable revenue trajectory, with a notable dip in 2016 but maintaining a steady recovery thereafter. By 2023, Johnson Controls' revenue had rebounded to around 27 billion dollars, showcasing resilience in a competitive market. This comparative analysis highlights the dynamic nature of these industries and the strategic maneuvers required to sustain growth.
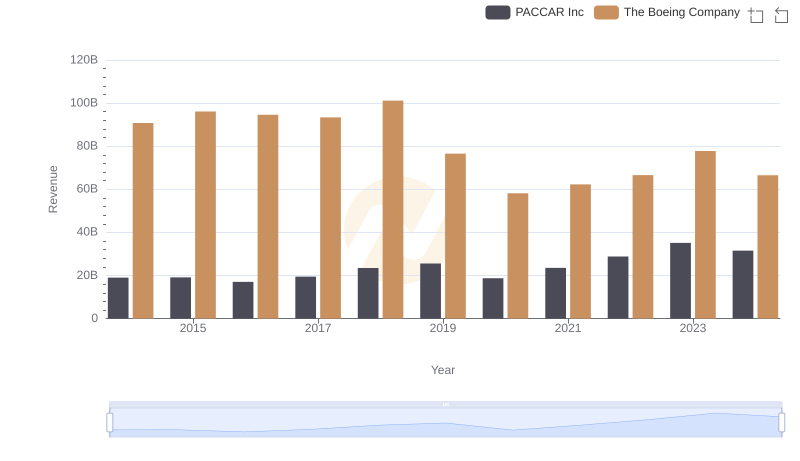
Revenue Insights: The Boeing Company and PACCAR Inc Performance Compared
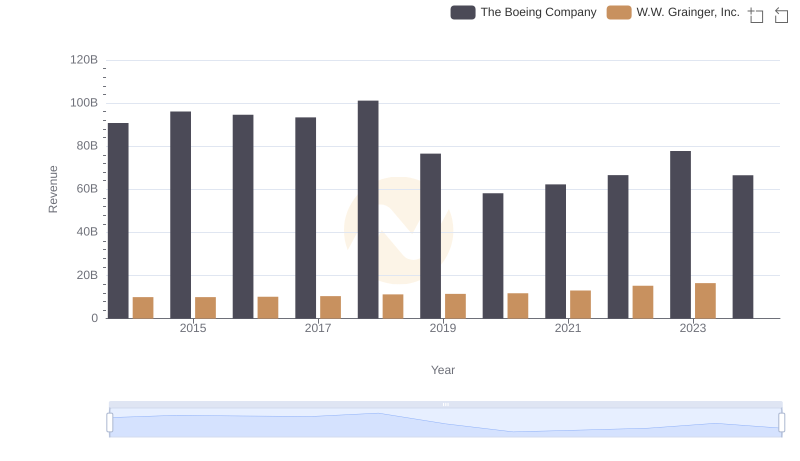
Comparing Revenue Performance: The Boeing Company or W.W. Grainger, Inc.?
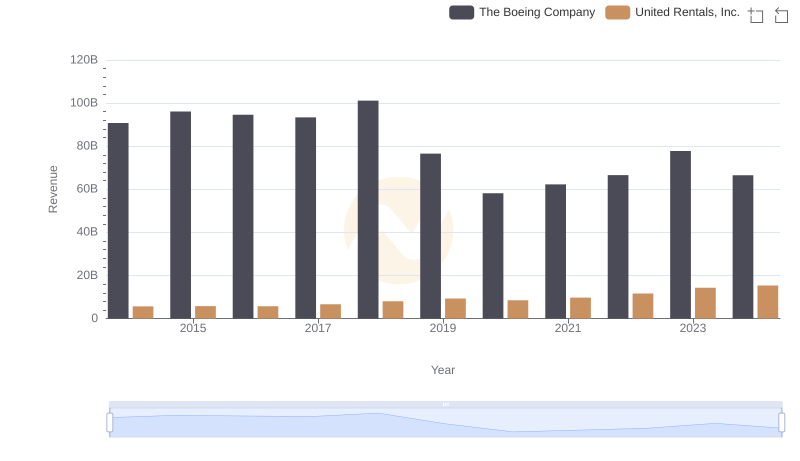
Revenue Insights: The Boeing Company and United Rentals, Inc. Performance Compared

The Boeing Company and Waste Connections, Inc.: A Comprehensive Revenue Analysis

The Boeing Company or Delta Air Lines, Inc.: Who Leads in Yearly Revenue?
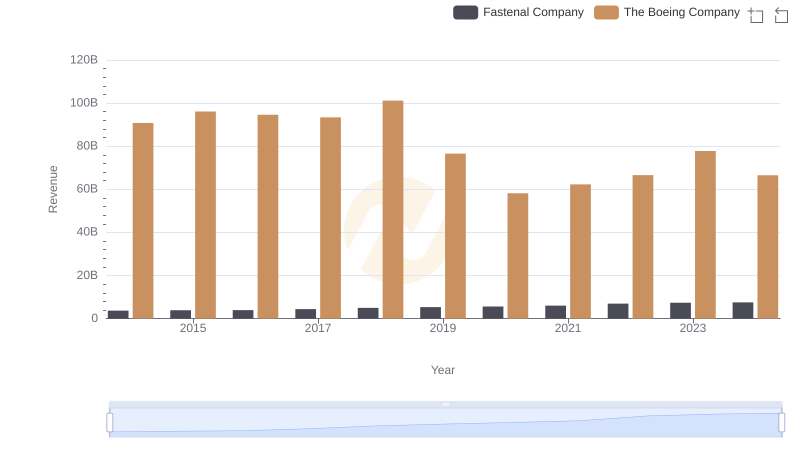
The Boeing Company and Fastenal Company: A Comprehensive Revenue Analysis
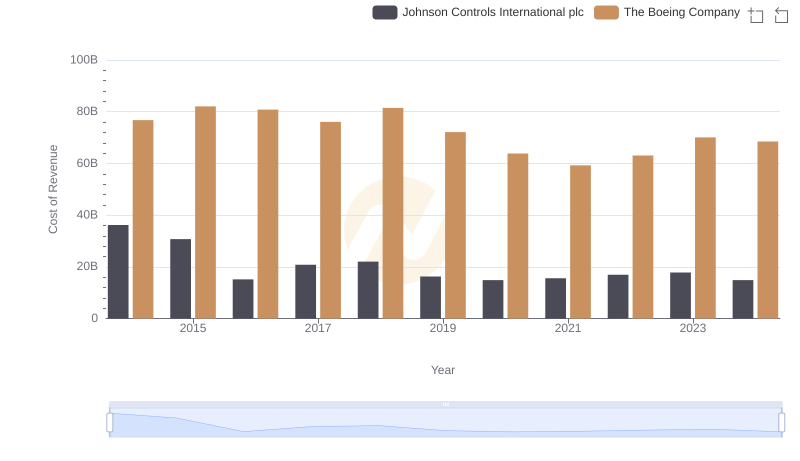
Analyzing Cost of Revenue: The Boeing Company and Johnson Controls International plc
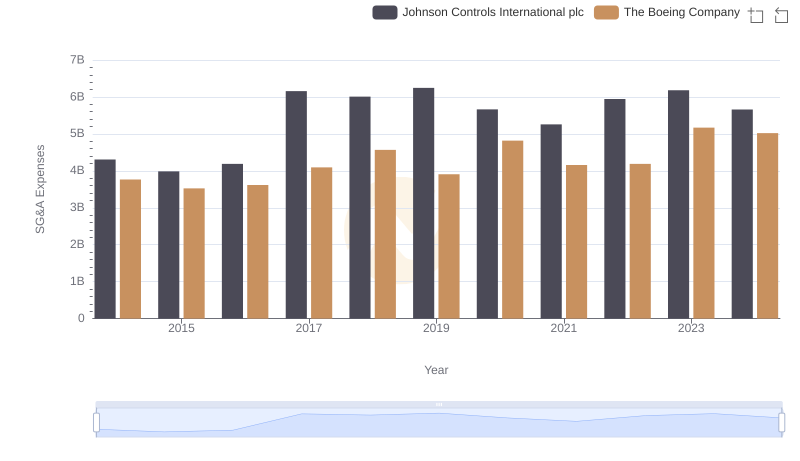
Operational Costs Compared: SG&A Analysis of The Boeing Company and Johnson Controls International plc