| __timestamp | The Boeing Company | W.W. Grainger, Inc. |
|---|---|---|
| Wednesday, January 1, 2014 | 3767000000 | 2967125000 |
| Thursday, January 1, 2015 | 3525000000 | 2931108000 |
| Friday, January 1, 2016 | 3616000000 | 2995060000 |
| Sunday, January 1, 2017 | 4094000000 | 3048895000 |
| Monday, January 1, 2018 | 4567000000 | 3190000000 |
| Tuesday, January 1, 2019 | 3909000000 | 3135000000 |
| Wednesday, January 1, 2020 | 4817000000 | 3219000000 |
| Friday, January 1, 2021 | 4157000000 | 3173000000 |
| Saturday, January 1, 2022 | 4187000000 | 3634000000 |
| Sunday, January 1, 2023 | 5168000000 | 3931000000 |
| Monday, January 1, 2024 | 5021000000 | 4121000000 |
Unveiling the hidden dimensions of data
In the world of corporate finance, Selling, General, and Administrative (SG&A) expenses are a crucial indicator of a company's operational efficiency. Over the past decade, The Boeing Company and W.W. Grainger, Inc. have showcased contrasting trends in their SG&A expenses.
From 2014 to 2023, Boeing's SG&A expenses soared by approximately 37%, peaking in 2023. This upward trajectory reflects Boeing's strategic investments and operational expansions, despite facing industry challenges.
Conversely, W.W. Grainger, Inc. maintained a more stable SG&A expense pattern, with a modest increase of around 32% over the same period. This consistency highlights Grainger's focus on cost management and operational efficiency.
Notably, 2024 data for Grainger is absent, leaving room for speculation on future trends. As these industry titans navigate their financial landscapes, their SG&A strategies will be pivotal in shaping their competitive edge.
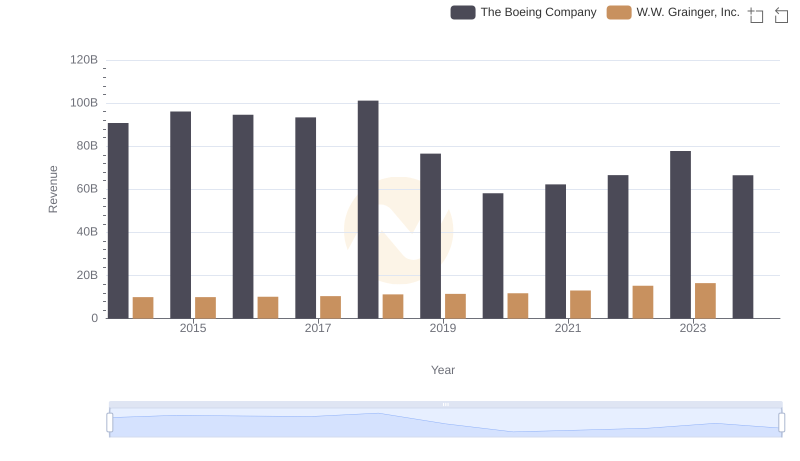
Comparing Revenue Performance: The Boeing Company or W.W. Grainger, Inc.?
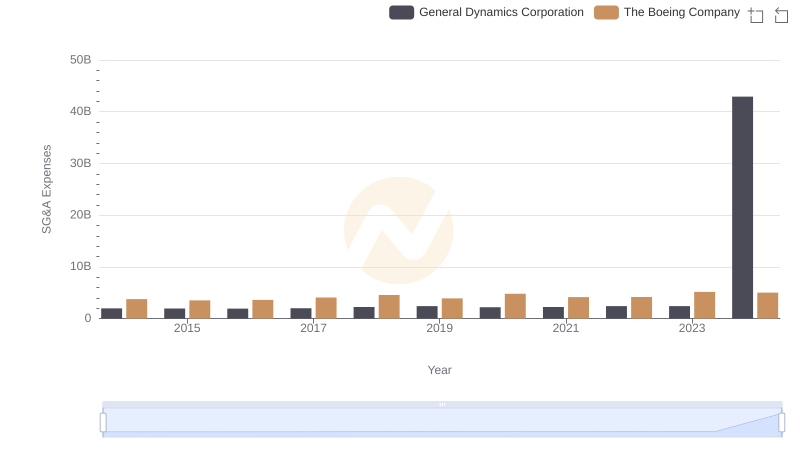
Operational Costs Compared: SG&A Analysis of The Boeing Company and General Dynamics Corporation
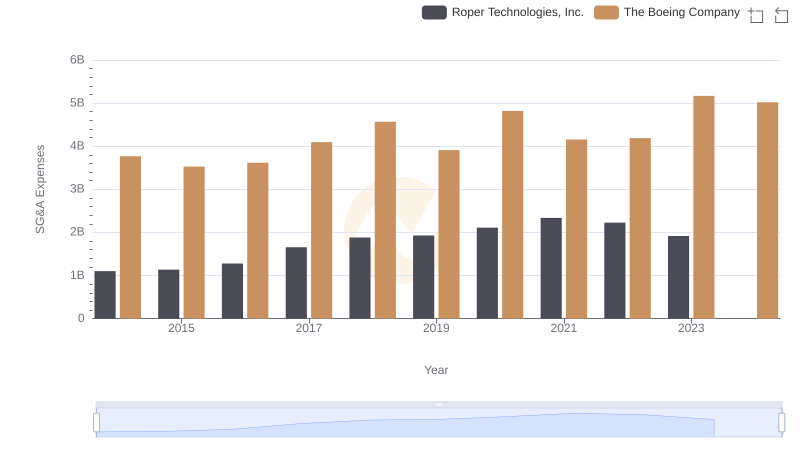
Cost Management Insights: SG&A Expenses for The Boeing Company and Roper Technologies, Inc.
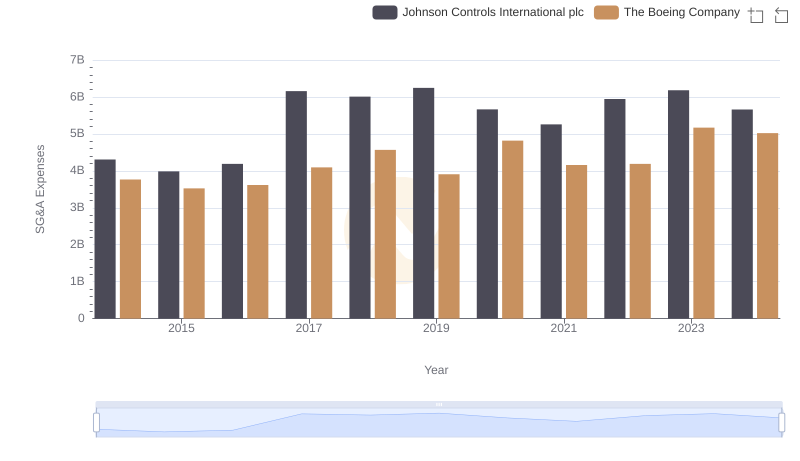
Operational Costs Compared: SG&A Analysis of The Boeing Company and Johnson Controls International plc
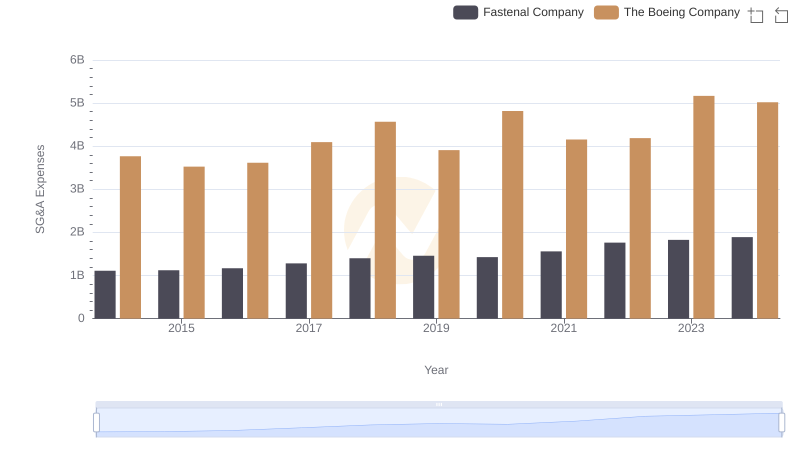
Who Optimizes SG&A Costs Better? The Boeing Company or Fastenal Company
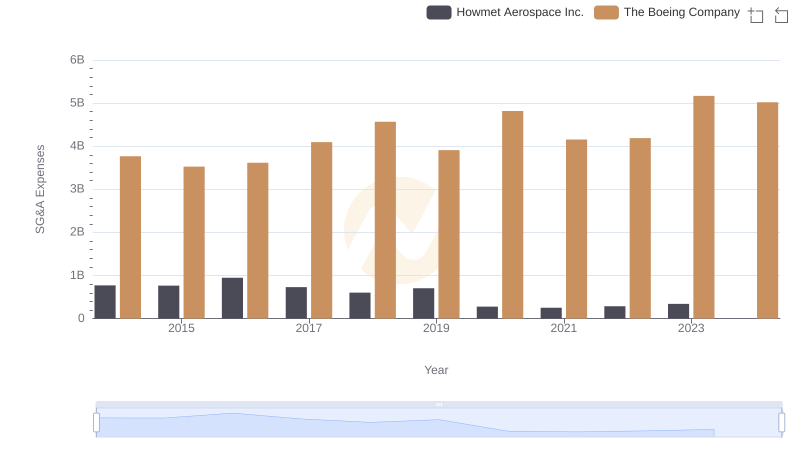
The Boeing Company or Howmet Aerospace Inc.: Who Manages SG&A Costs Better?
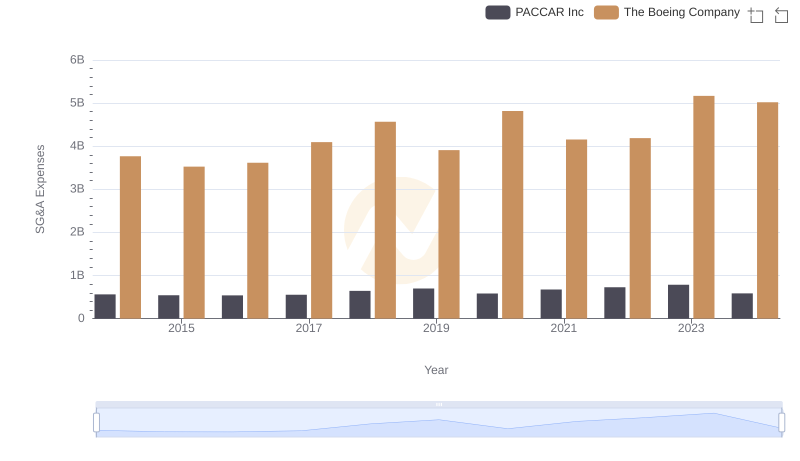
Who Optimizes SG&A Costs Better? The Boeing Company or PACCAR Inc
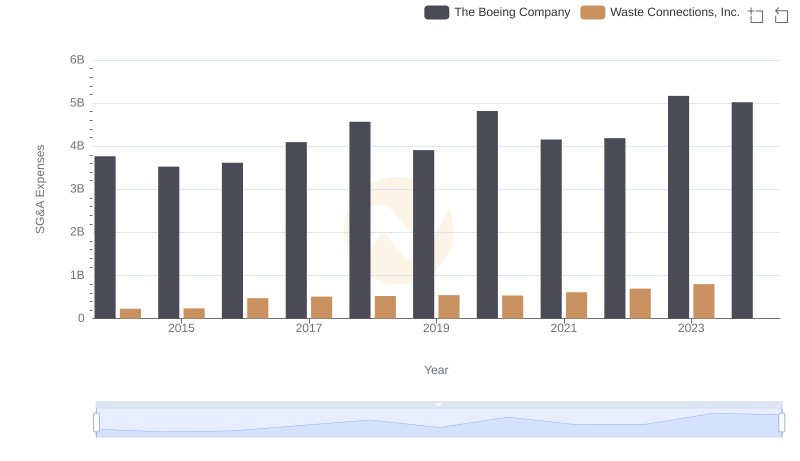
Who Optimizes SG&A Costs Better? The Boeing Company or Waste Connections, Inc.