| __timestamp | Johnson Controls International plc | The Boeing Company |
|---|---|---|
| Wednesday, January 1, 2014 | 36201000000 | 76752000000 |
| Thursday, January 1, 2015 | 30732000000 | 82088000000 |
| Friday, January 1, 2016 | 15183000000 | 80790000000 |
| Sunday, January 1, 2017 | 20833000000 | 76066000000 |
| Monday, January 1, 2018 | 22020000000 | 81490000000 |
| Tuesday, January 1, 2019 | 16275000000 | 72093000000 |
| Wednesday, January 1, 2020 | 14906000000 | 63843000000 |
| Friday, January 1, 2021 | 15609000000 | 59237000000 |
| Saturday, January 1, 2022 | 16956000000 | 63078000000 |
| Sunday, January 1, 2023 | 17822000000 | 70070000000 |
| Monday, January 1, 2024 | 14875000000 | 68508000000 |
Unleashing the power of data
In the ever-evolving landscape of aerospace and building technologies, understanding cost dynamics is crucial. From 2014 to 2024, The Boeing Company and Johnson Controls International plc have shown distinct trends in their cost of revenue. Boeing, a titan in aerospace, saw its cost of revenue peak in 2015, followed by a gradual decline, reaching its lowest in 2021. This represents a 28% decrease over the decade, reflecting strategic cost management amidst industry challenges.
Conversely, Johnson Controls, a leader in building technologies, experienced a significant drop in 2016, with costs stabilizing thereafter. By 2023, their cost of revenue had decreased by 51% from its 2014 peak, indicating effective cost control measures. These trends highlight the companies' adaptive strategies in response to market demands and economic shifts, offering valuable insights for investors and industry analysts.
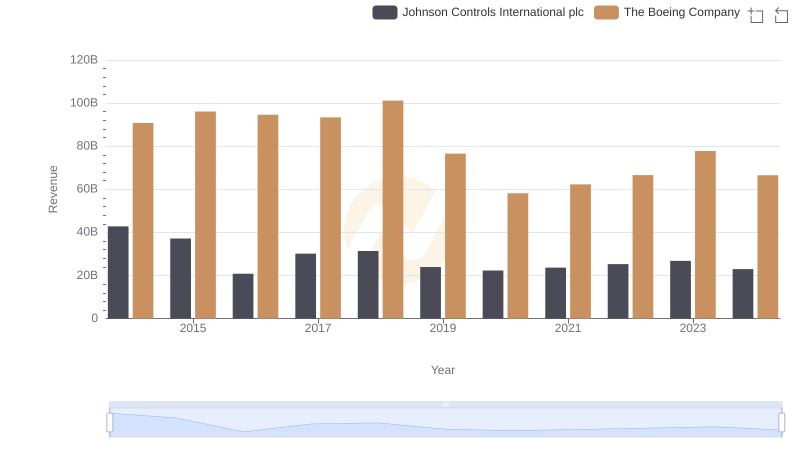
The Boeing Company vs Johnson Controls International plc: Examining Key Revenue Metrics
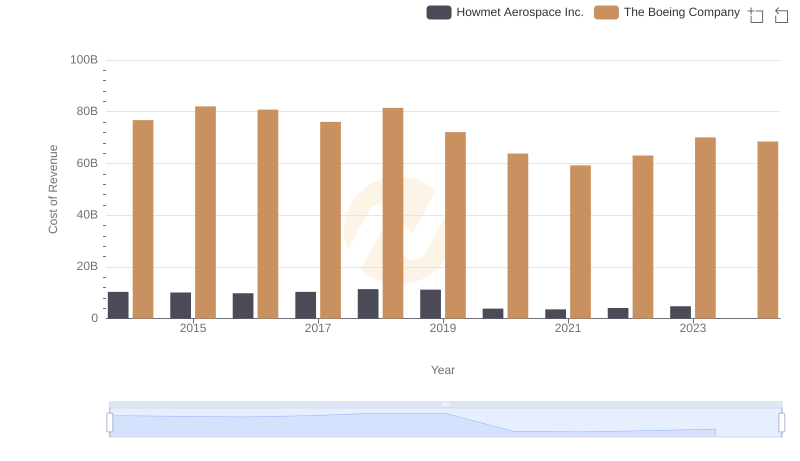
Analyzing Cost of Revenue: The Boeing Company and Howmet Aerospace Inc.

Cost Insights: Breaking Down The Boeing Company and United Rentals, Inc.'s Expenses
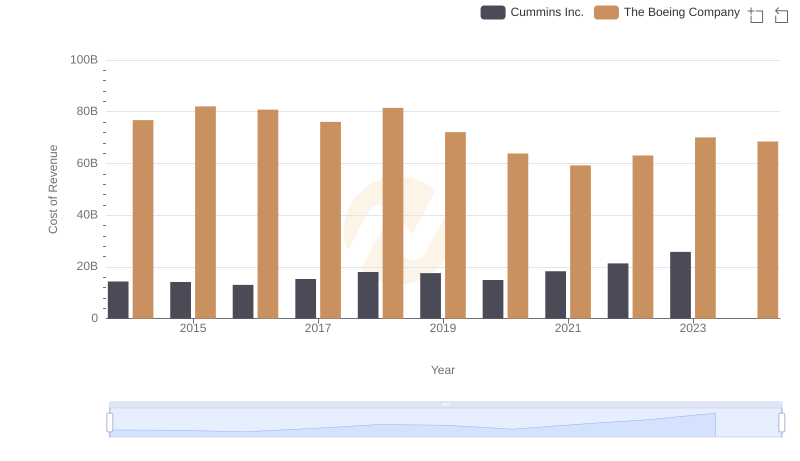
Cost of Revenue Comparison: The Boeing Company vs Cummins Inc.
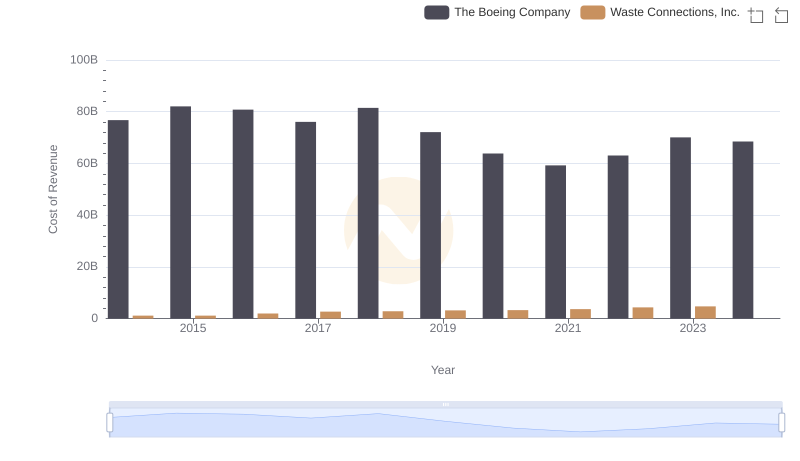
Cost of Revenue Trends: The Boeing Company vs Waste Connections, Inc.
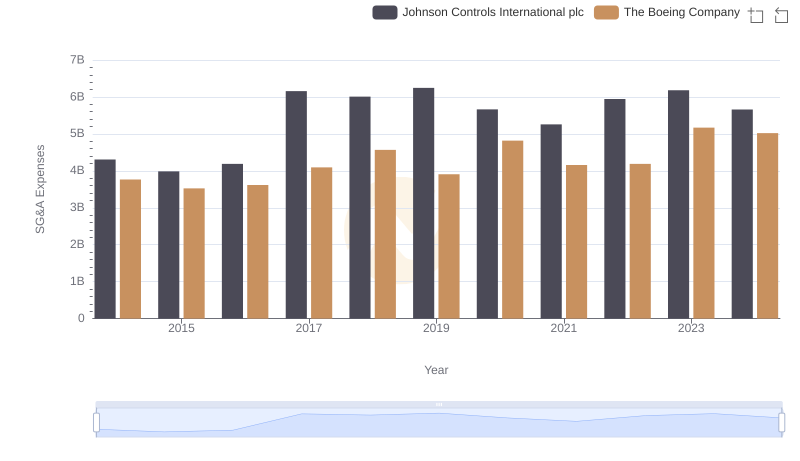
Operational Costs Compared: SG&A Analysis of The Boeing Company and Johnson Controls International plc