| __timestamp | Avery Dennison Corporation | Parker-Hannifin Corporation |
|---|---|---|
| Wednesday, January 1, 2014 | 1155300000 | 1633992000 |
| Thursday, January 1, 2015 | 1108100000 | 1544746000 |
| Friday, January 1, 2016 | 1097500000 | 1359360000 |
| Sunday, January 1, 2017 | 1123200000 | 1453935000 |
| Monday, January 1, 2018 | 1127500000 | 1657152000 |
| Tuesday, January 1, 2019 | 1080400000 | 1543939000 |
| Wednesday, January 1, 2020 | 1060500000 | 1656553000 |
| Friday, January 1, 2021 | 1248500000 | 1527302000 |
| Saturday, January 1, 2022 | 1330800000 | 1627116000 |
| Sunday, January 1, 2023 | 1177900000 | 3354103000 |
| Monday, January 1, 2024 | 1415300000 | 3315177000 |
Igniting the spark of knowledge
In the world of industrial and manufacturing giants, understanding spending patterns is crucial. Parker-Hannifin Corporation and Avery Dennison Corporation, two stalwarts in their respective fields, have shown distinct trends in their Selling, General, and Administrative (SG&A) expenses over the past decade. From 2014 to 2023, Parker-Hannifin's SG&A expenses have seen a significant increase, peaking in 2023 with a staggering 105% rise compared to 2014. In contrast, Avery Dennison's expenses have remained relatively stable, with a modest 15% increase over the same period.
The year 2023 marked a dramatic shift for Parker-Hannifin, with expenses soaring to unprecedented levels, while Avery Dennison maintained a steady course. This divergence highlights the strategic differences in managing operational costs between the two companies. As we look to the future, these patterns may offer insights into their competitive positioning and market strategies.
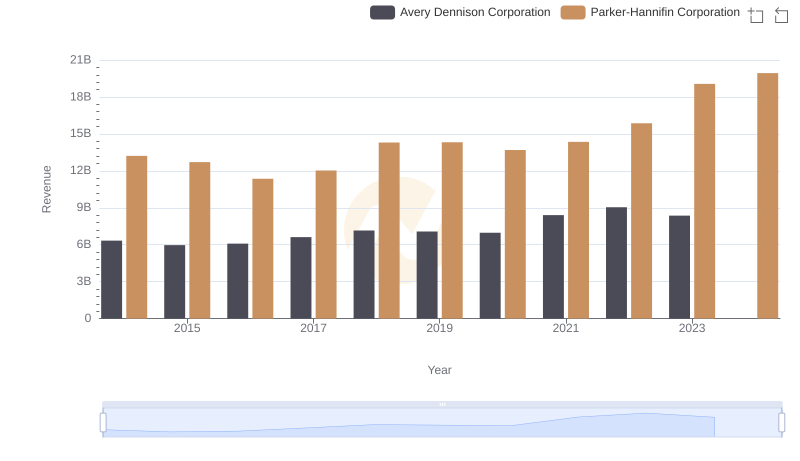
Comparing Revenue Performance: Parker-Hannifin Corporation or Avery Dennison Corporation?
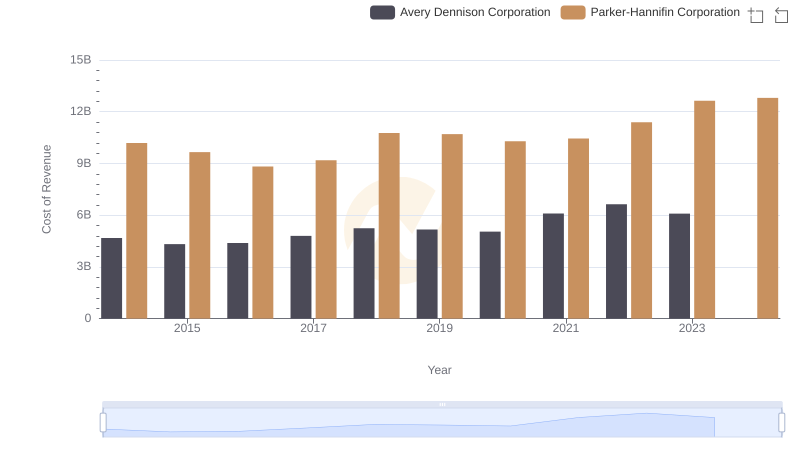
Cost of Revenue Trends: Parker-Hannifin Corporation vs Avery Dennison Corporation
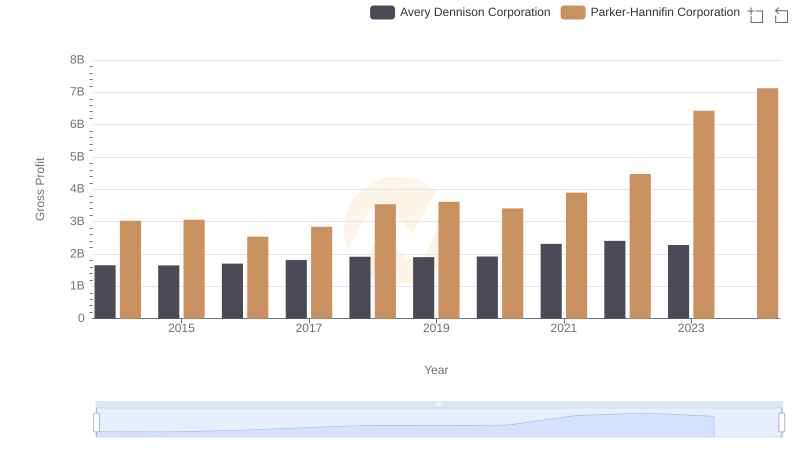
Gross Profit Comparison: Parker-Hannifin Corporation and Avery Dennison Corporation Trends
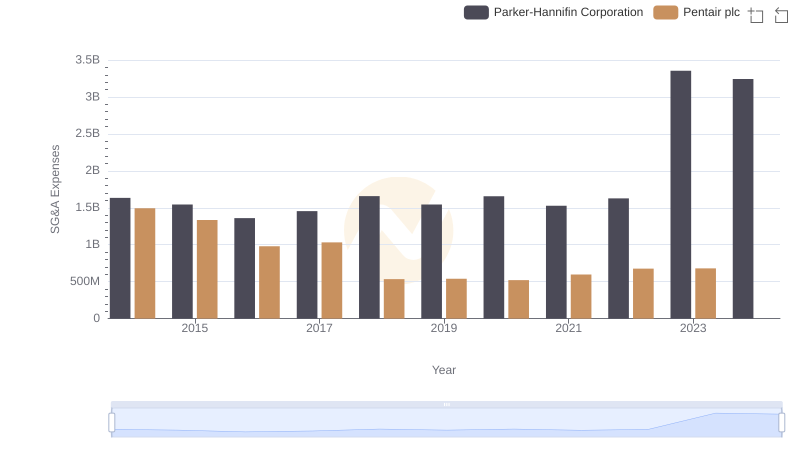
Who Optimizes SG&A Costs Better? Parker-Hannifin Corporation or Pentair plc
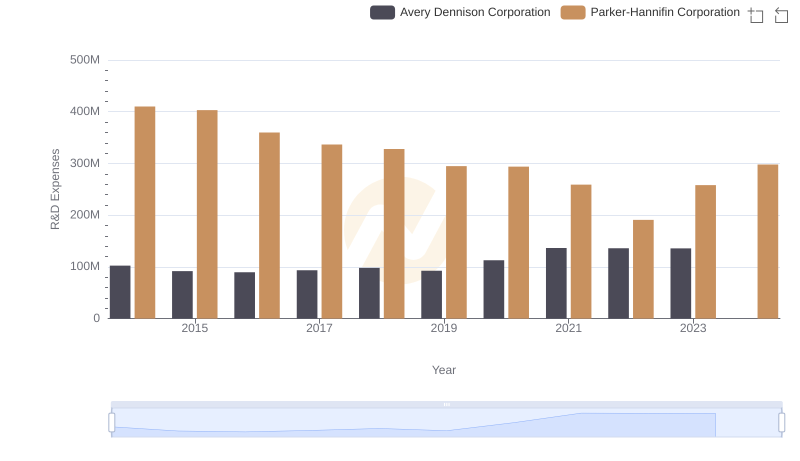
Analyzing R&D Budgets: Parker-Hannifin Corporation vs Avery Dennison Corporation
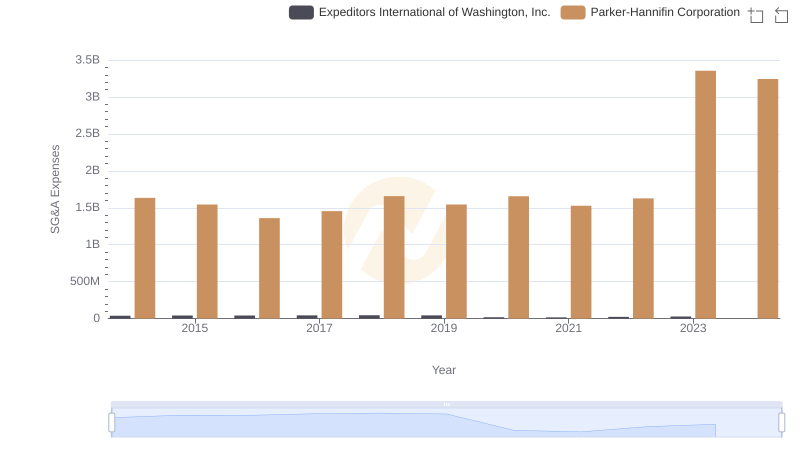
Who Optimizes SG&A Costs Better? Parker-Hannifin Corporation or Expeditors International of Washington, Inc.
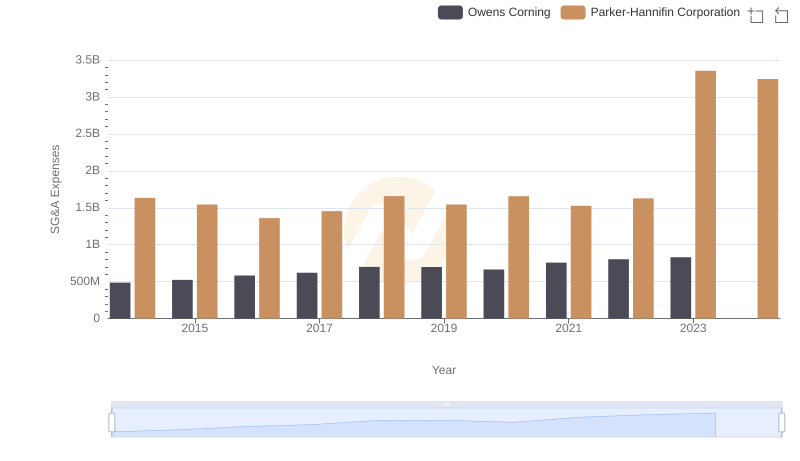
Operational Costs Compared: SG&A Analysis of Parker-Hannifin Corporation and Owens Corning
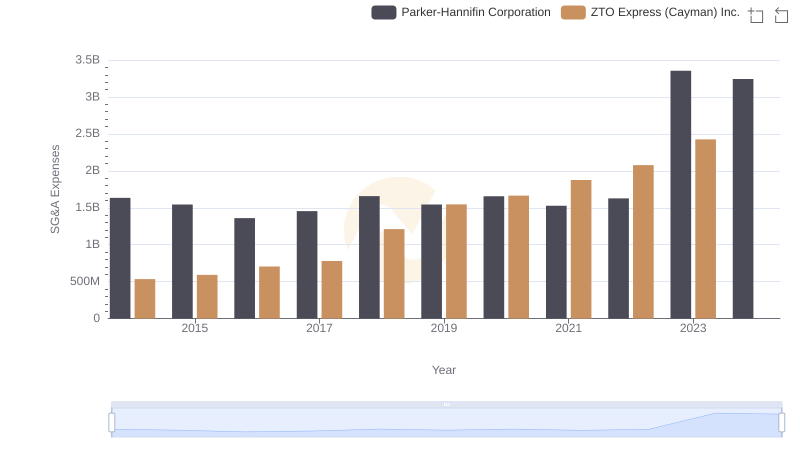
SG&A Efficiency Analysis: Comparing Parker-Hannifin Corporation and ZTO Express (Cayman) Inc.
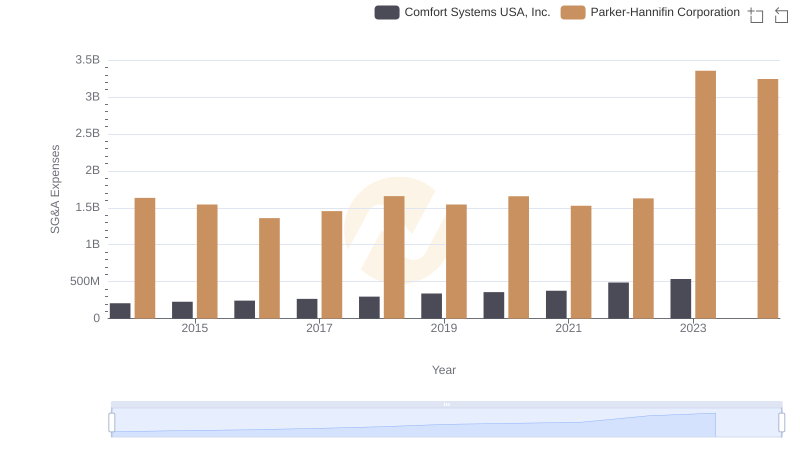
Operational Costs Compared: SG&A Analysis of Parker-Hannifin Corporation and Comfort Systems USA, Inc.
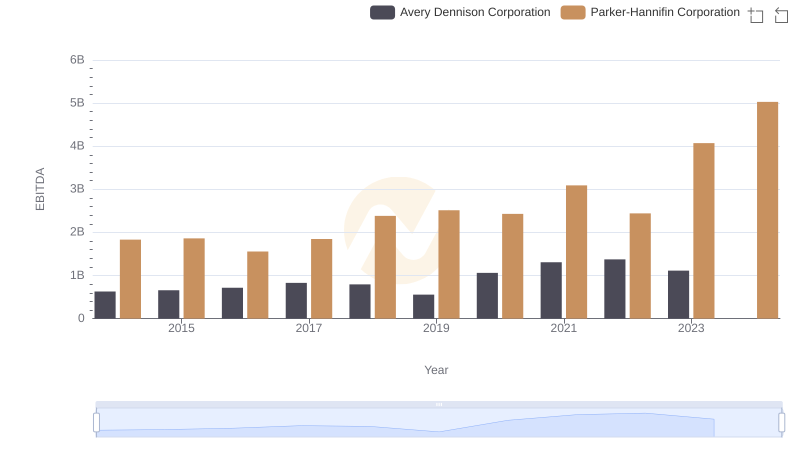
EBITDA Metrics Evaluated: Parker-Hannifin Corporation vs Avery Dennison Corporation