| __timestamp | Garmin Ltd. | International Business Machines Corporation |
|---|---|---|
| Wednesday, January 1, 2014 | 1604412000 | 46407000000 |
| Thursday, January 1, 2015 | 1538704000 | 40684000000 |
| Friday, January 1, 2016 | 1679570000 | 38516000000 |
| Sunday, January 1, 2017 | 1783164000 | 36943000000 |
| Monday, January 1, 2018 | 1979719000 | 36936000000 |
| Tuesday, January 1, 2019 | 2233976000 | 31533000000 |
| Wednesday, January 1, 2020 | 2481336000 | 30865000000 |
| Friday, January 1, 2021 | 2890459000 | 31486000000 |
| Saturday, January 1, 2022 | 2806775000 | 32687000000 |
| Sunday, January 1, 2023 | 3004955000 | 34300000000 |
| Monday, January 1, 2024 | 3696555000 | 35551000000 |
Unleashing insights
In the ever-evolving landscape of technology and innovation, the financial performance of industry giants like International Business Machines Corporation (IBM) and Garmin Ltd. offers a fascinating glimpse into their strategic trajectories. Over the past decade, IBM's gross profit has shown a steady decline, dropping from a peak in 2014 to a more modest figure in 2023. This represents a decrease of approximately 26% over the period, reflecting the company's ongoing transformation and adaptation to new market demands.
Conversely, Garmin Ltd. has experienced a robust upward trend, with its gross profit nearly doubling from 2014 to 2023. This impressive growth underscores Garmin's successful expansion into new product lines and markets. The data for 2024 is incomplete, but the trends suggest continued divergence in the financial fortunes of these two tech titans. As the industry continues to evolve, these trends highlight the dynamic nature of competition and innovation.
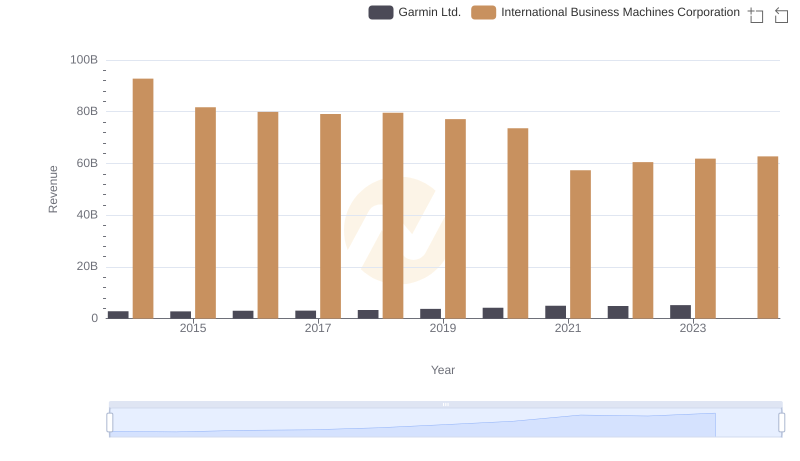
International Business Machines Corporation vs Garmin Ltd.: Examining Key Revenue Metrics
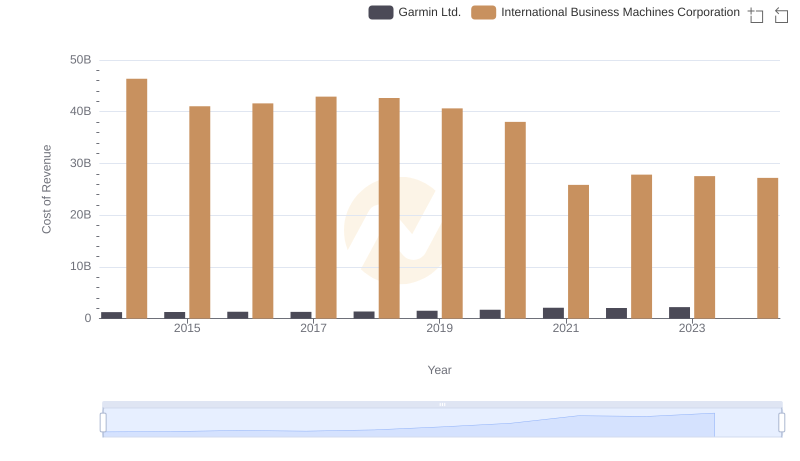
Cost of Revenue Comparison: International Business Machines Corporation vs Garmin Ltd.
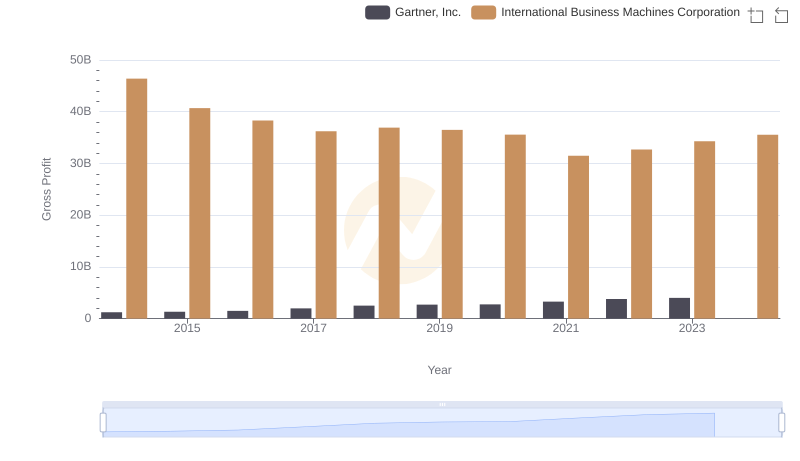
Who Generates Higher Gross Profit? International Business Machines Corporation or Gartner, Inc.
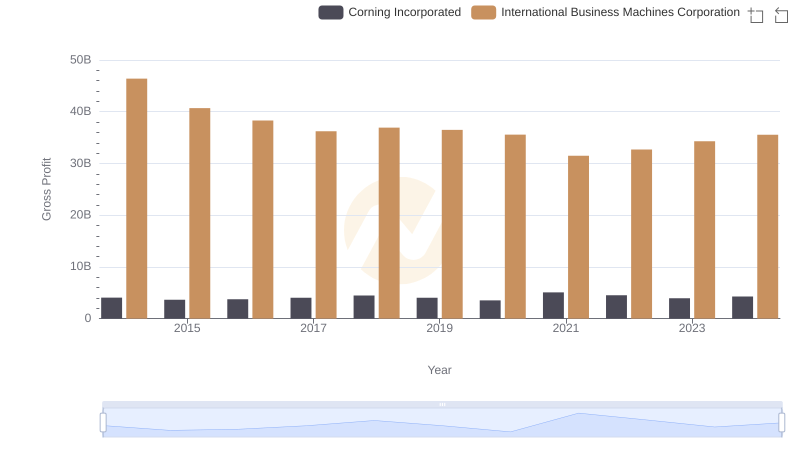
Key Insights on Gross Profit: International Business Machines Corporation vs Corning Incorporated
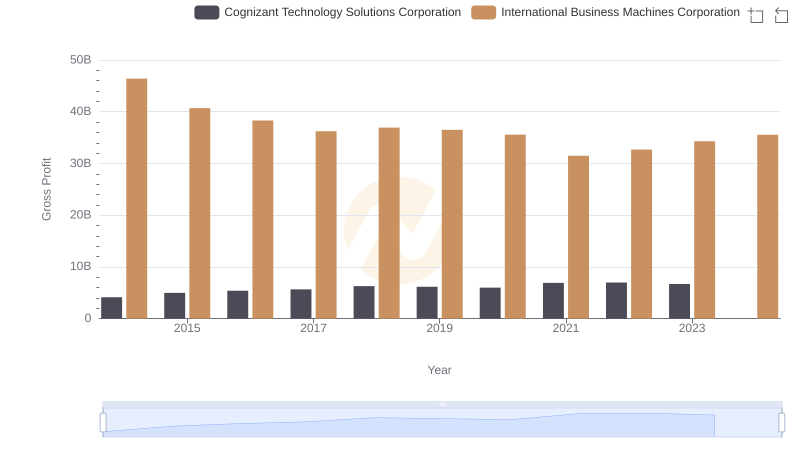
International Business Machines Corporation vs Cognizant Technology Solutions Corporation: A Gross Profit Performance Breakdown
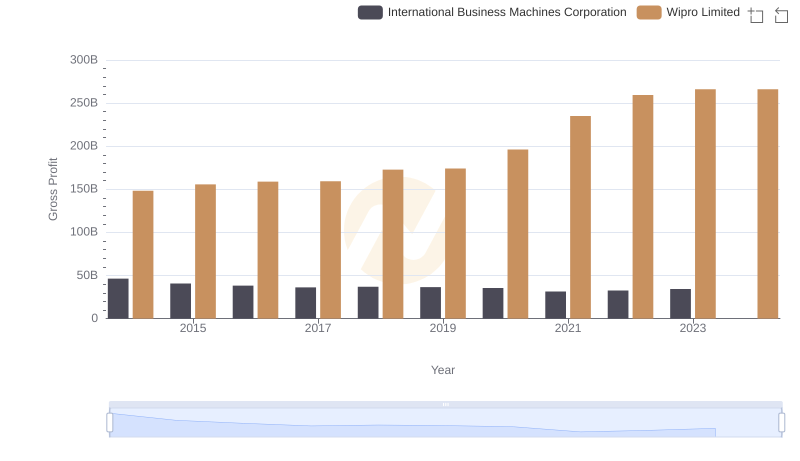
Who Generates Higher Gross Profit? International Business Machines Corporation or Wipro Limited
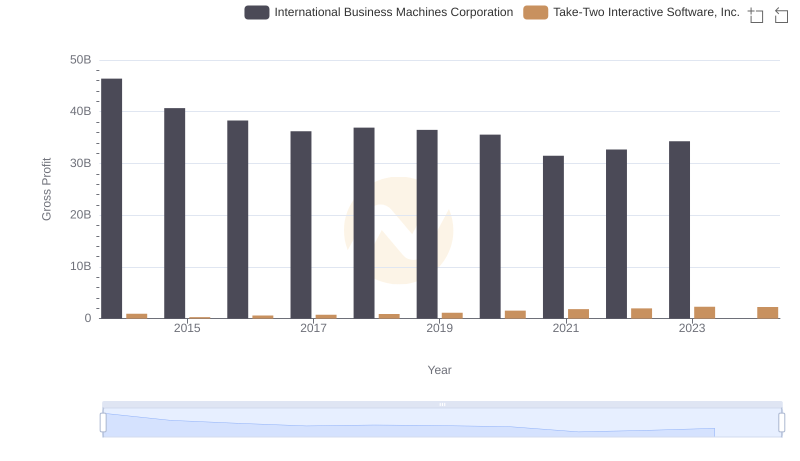
International Business Machines Corporation and Take-Two Interactive Software, Inc.: A Detailed Gross Profit Analysis
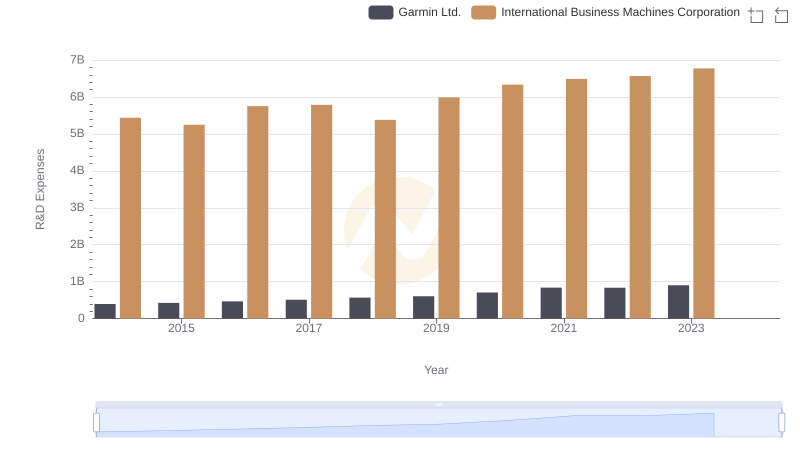
R&D Spending Showdown: International Business Machines Corporation vs Garmin Ltd.
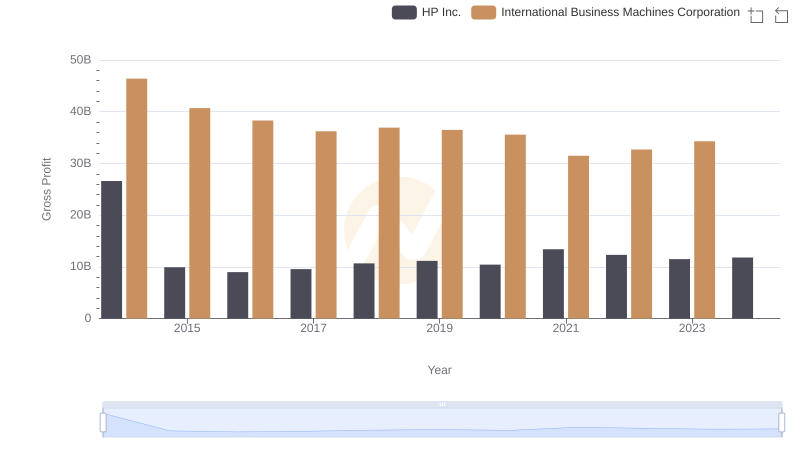
Key Insights on Gross Profit: International Business Machines Corporation vs HP Inc.
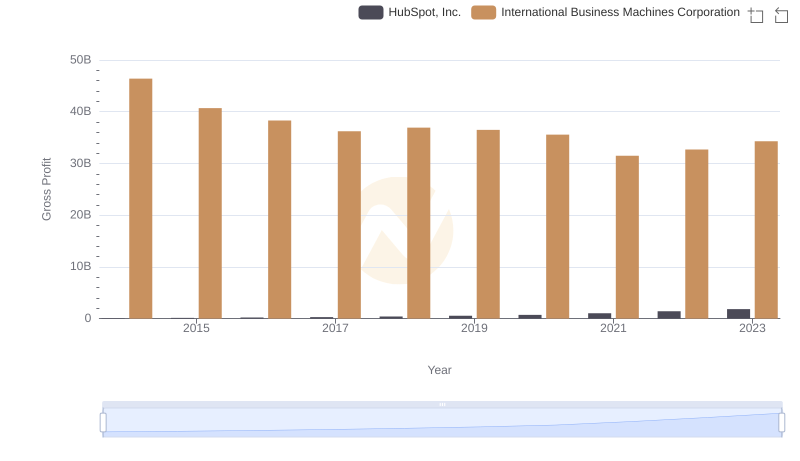
Gross Profit Trends Compared: International Business Machines Corporation vs HubSpot, Inc.
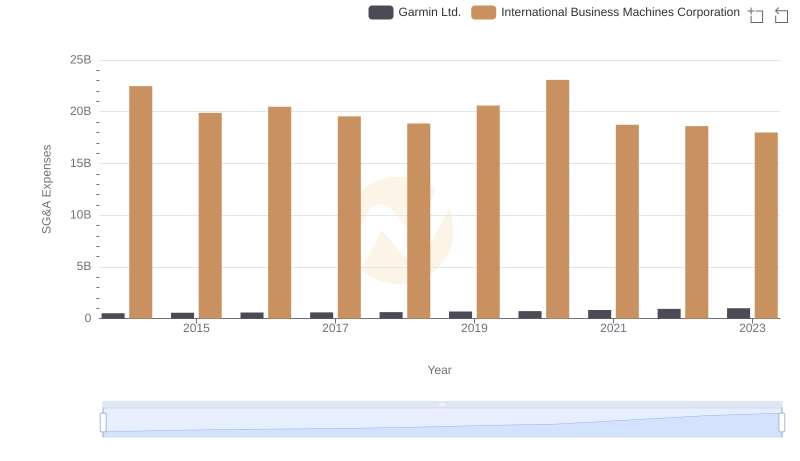
Operational Costs Compared: SG&A Analysis of International Business Machines Corporation and Garmin Ltd.
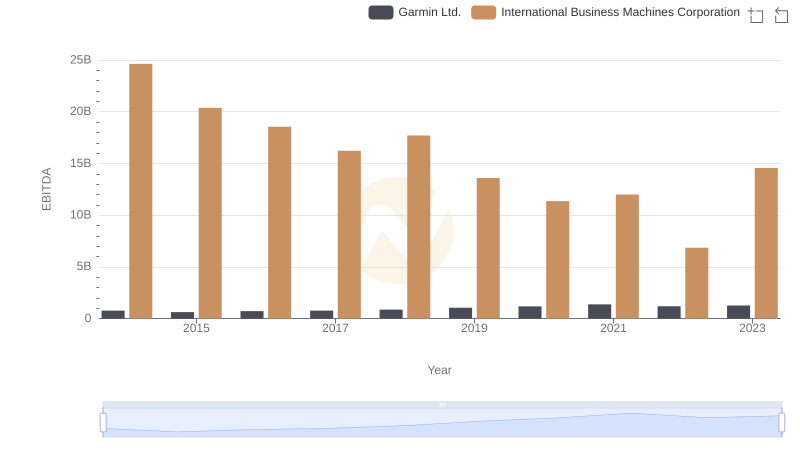
EBITDA Metrics Evaluated: International Business Machines Corporation vs Garmin Ltd.