| __timestamp | Eaton Corporation plc | Lennox International Inc. |
|---|---|---|
| Wednesday, January 1, 2014 | 3810000000 | 573700000 |
| Thursday, January 1, 2015 | 3596000000 | 580500000 |
| Friday, January 1, 2016 | 3505000000 | 621000000 |
| Sunday, January 1, 2017 | 3565000000 | 637700000 |
| Monday, January 1, 2018 | 3548000000 | 608200000 |
| Tuesday, January 1, 2019 | 3583000000 | 585900000 |
| Wednesday, January 1, 2020 | 3075000000 | 555900000 |
| Friday, January 1, 2021 | 3256000000 | 598900000 |
| Saturday, January 1, 2022 | 3227000000 | 627200000 |
| Sunday, January 1, 2023 | 3795000000 | 705500000 |
| Monday, January 1, 2024 | 4077000000 | 730600000 |
Cracking the code
Over the past decade, the landscape of operational costs has evolved significantly for major corporations. Eaton Corporation plc and Lennox International Inc. provide a fascinating case study in this regard. From 2014 to 2023, Eaton's Selling, General, and Administrative (SG&A) expenses have shown a fluctuating trend, peaking in 2014 and 2023, with a notable dip in 2020. This reflects a strategic shift, possibly influenced by global economic conditions and internal restructuring. In contrast, Lennox International Inc. has demonstrated a steady increase in SG&A expenses, culminating in a 23% rise from 2014 to 2023. This consistent growth suggests a robust expansion strategy, despite the challenges posed by the pandemic. Interestingly, the data for 2024 is incomplete, leaving room for speculation on future trends. This analysis underscores the dynamic nature of operational costs and the strategic decisions that drive them.
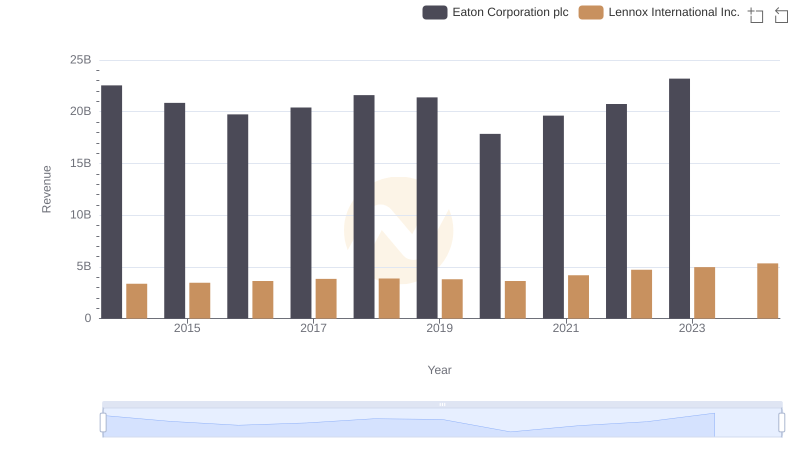
Revenue Insights: Eaton Corporation plc and Lennox International Inc. Performance Compared
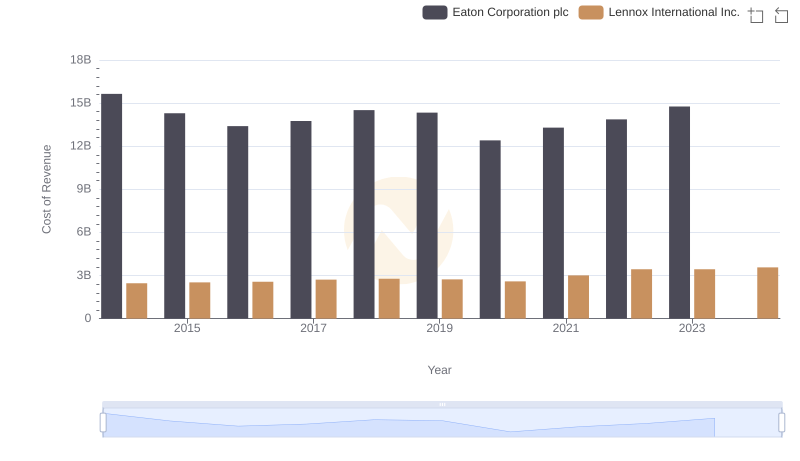
Analyzing Cost of Revenue: Eaton Corporation plc and Lennox International Inc.
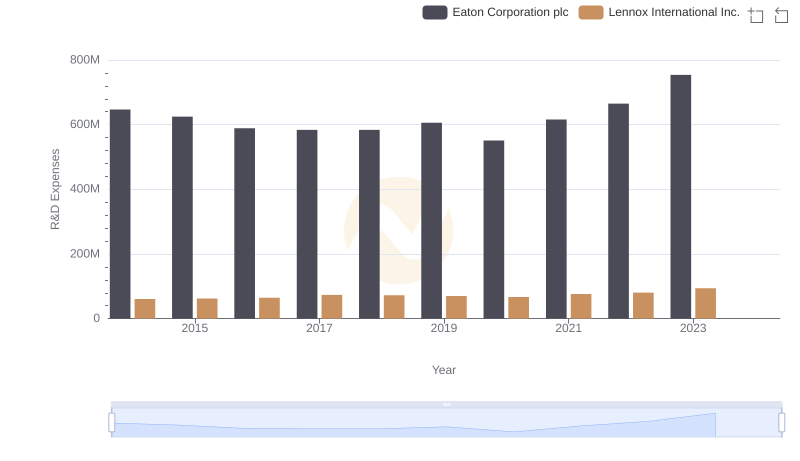
Comparing Innovation Spending: Eaton Corporation plc and Lennox International Inc.
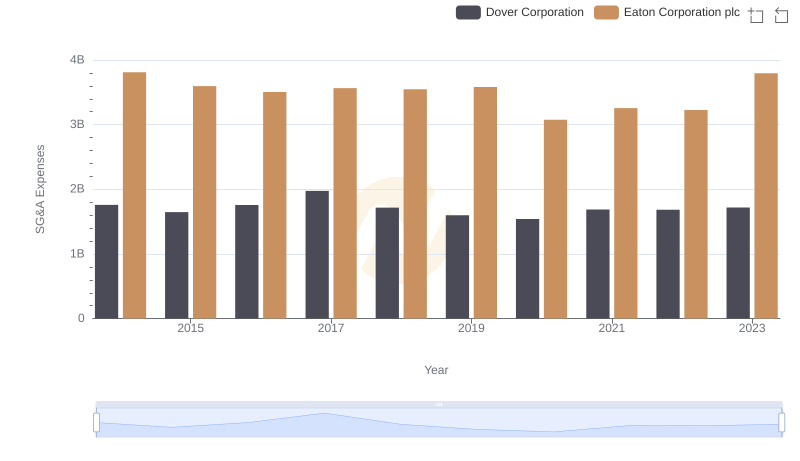
Comparing SG&A Expenses: Eaton Corporation plc vs Dover Corporation Trends and Insights
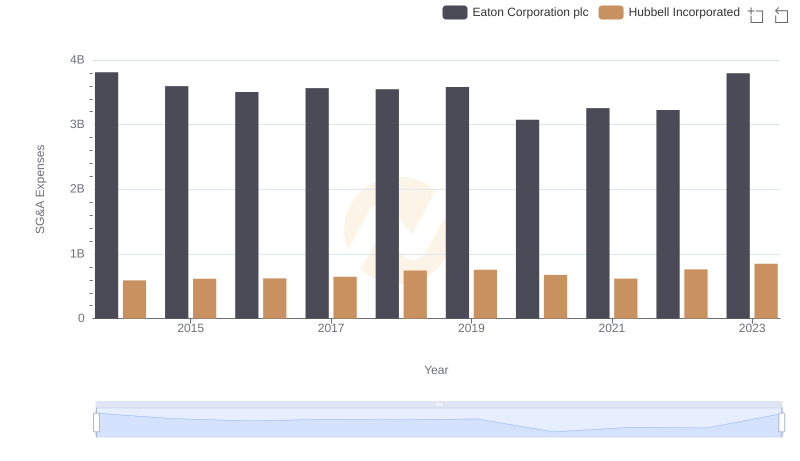
Operational Costs Compared: SG&A Analysis of Eaton Corporation plc and Hubbell Incorporated
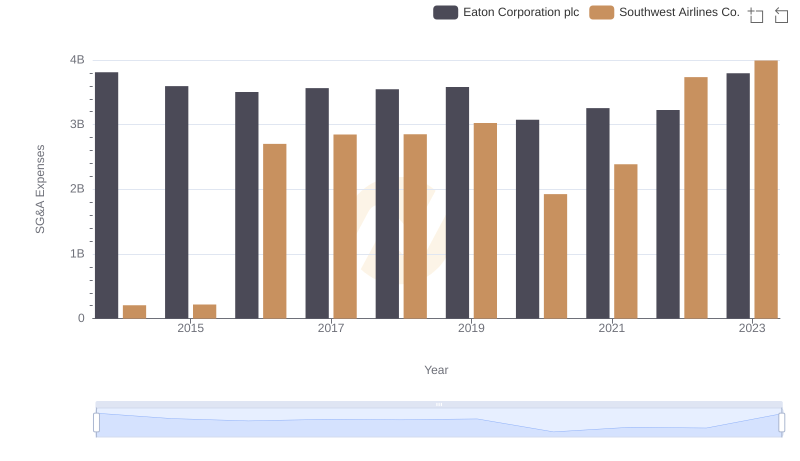
Eaton Corporation plc or Southwest Airlines Co.: Who Manages SG&A Costs Better?
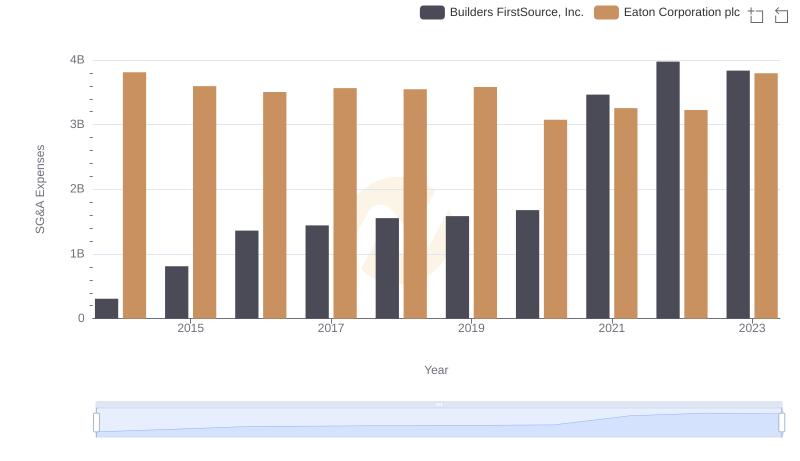
Cost Management Insights: SG&A Expenses for Eaton Corporation plc and Builders FirstSource, Inc.
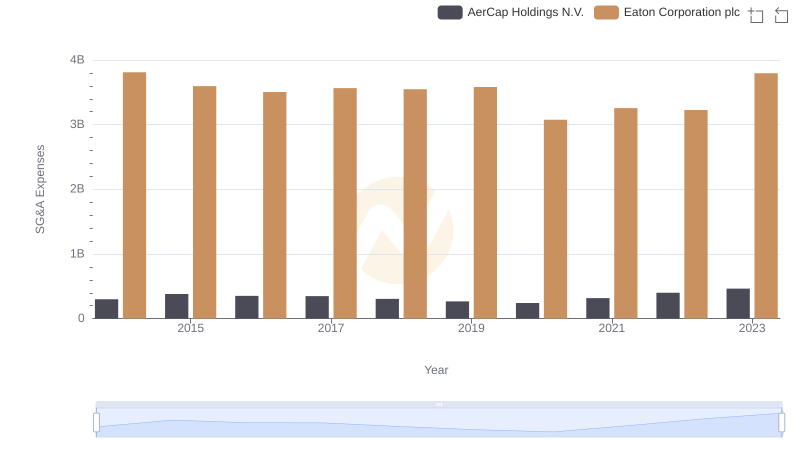
Who Optimizes SG&A Costs Better? Eaton Corporation plc or AerCap Holdings N.V.
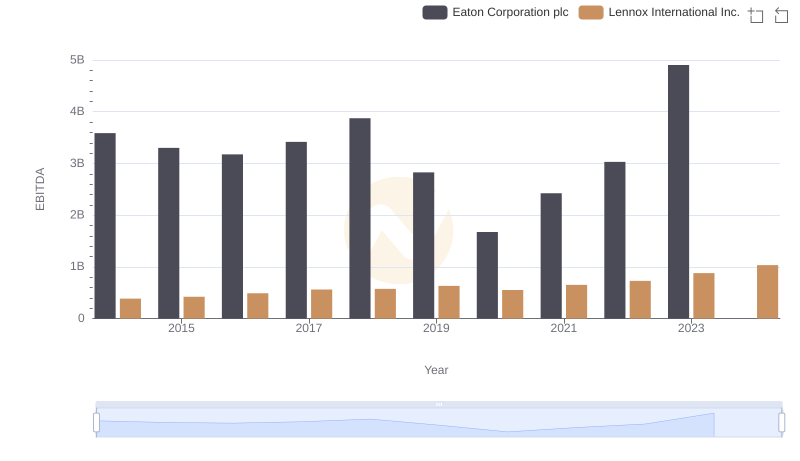
Eaton Corporation plc vs Lennox International Inc.: In-Depth EBITDA Performance Comparison