| __timestamp | Eaton Corporation plc | Lennox International Inc. |
|---|---|---|
| Wednesday, January 1, 2014 | 22552000000 | 3367400000 |
| Thursday, January 1, 2015 | 20855000000 | 3467400000 |
| Friday, January 1, 2016 | 19747000000 | 3641600000 |
| Sunday, January 1, 2017 | 20404000000 | 3839600000 |
| Monday, January 1, 2018 | 21609000000 | 3883900000 |
| Tuesday, January 1, 2019 | 21390000000 | 3807200000 |
| Wednesday, January 1, 2020 | 17858000000 | 3634100000 |
| Friday, January 1, 2021 | 19628000000 | 4194100000 |
| Saturday, January 1, 2022 | 20752000000 | 4718400000 |
| Sunday, January 1, 2023 | 23196000000 | 4981900000 |
| Monday, January 1, 2024 | 24878000000 | 5341300000 |
Unleashing insights
In the competitive landscape of industrial manufacturing, Eaton Corporation plc and Lennox International Inc. have showcased distinct revenue trajectories over the past decade. From 2014 to 2023, Eaton Corporation plc experienced a steady revenue increase, peaking at approximately $23.2 billion in 2023, marking a 3% growth from the previous year. This growth reflects Eaton's strategic expansions and robust market presence.
Conversely, Lennox International Inc. demonstrated a remarkable revenue surge, with a 48% increase from 2014 to 2023, reaching nearly $5 billion. This impressive growth underscores Lennox's successful adaptation to market demands and innovation in HVAC solutions.
While Eaton's revenue dipped in 2020, likely due to global economic challenges, Lennox maintained a consistent upward trend, highlighting its resilience. The data for 2024 remains incomplete, leaving room for speculation on future performance.
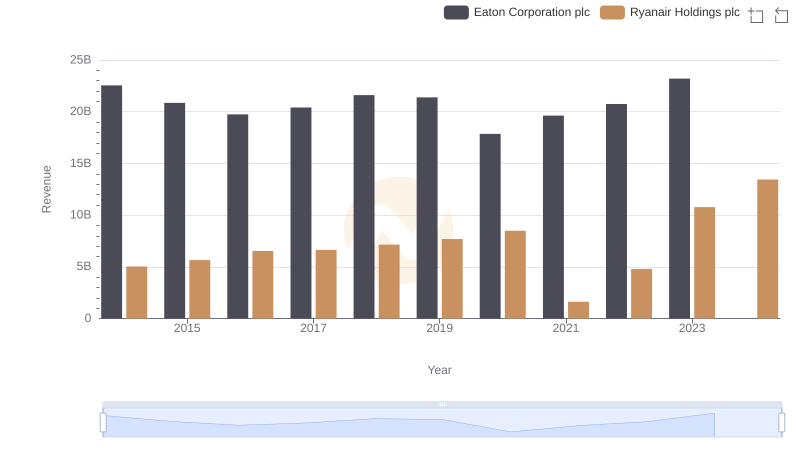
Breaking Down Revenue Trends: Eaton Corporation plc vs Ryanair Holdings plc
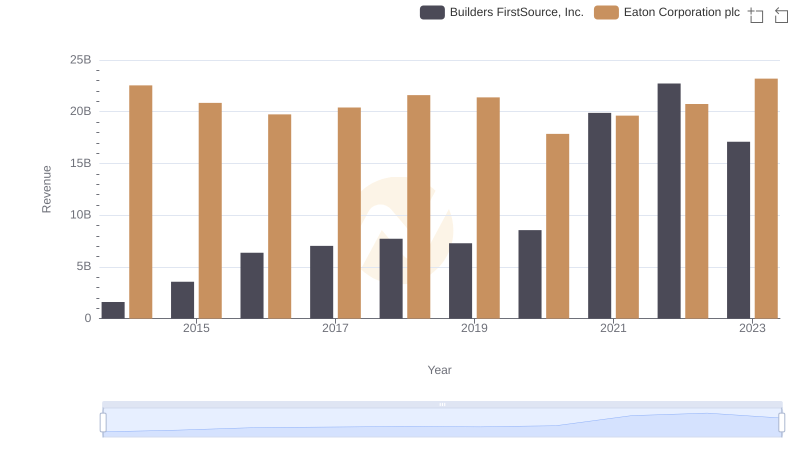
Eaton Corporation plc or Builders FirstSource, Inc.: Who Leads in Yearly Revenue?
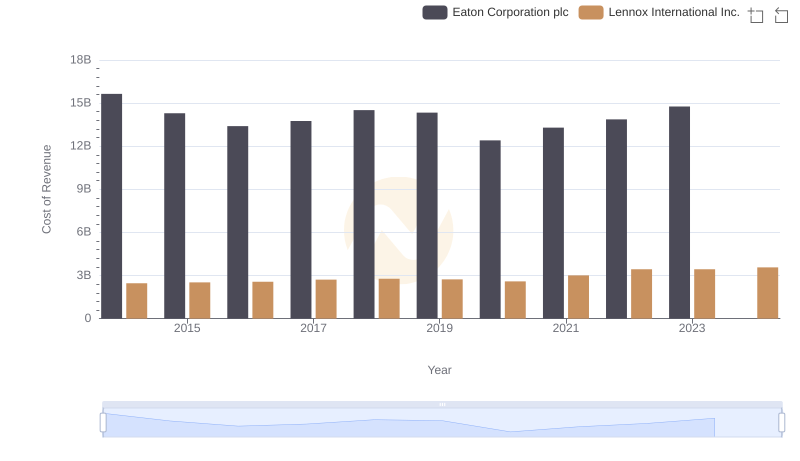
Analyzing Cost of Revenue: Eaton Corporation plc and Lennox International Inc.
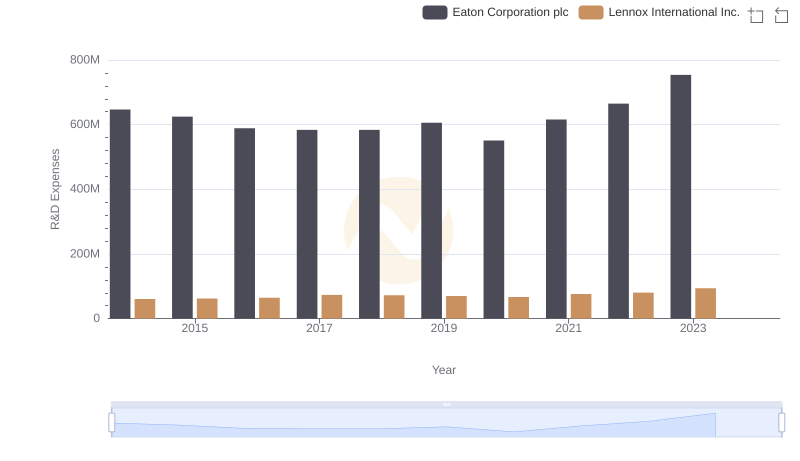
Comparing Innovation Spending: Eaton Corporation plc and Lennox International Inc.

Operational Costs Compared: SG&A Analysis of Eaton Corporation plc and Lennox International Inc.
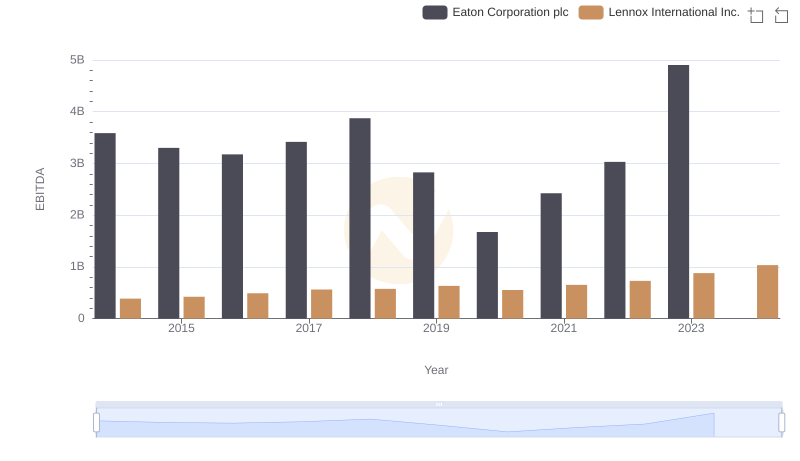
Eaton Corporation plc vs Lennox International Inc.: In-Depth EBITDA Performance Comparison