| __timestamp | Eaton Corporation plc | Hubbell Incorporated |
|---|---|---|
| Wednesday, January 1, 2014 | 3810000000 | 591600000 |
| Thursday, January 1, 2015 | 3596000000 | 617200000 |
| Friday, January 1, 2016 | 3505000000 | 622900000 |
| Sunday, January 1, 2017 | 3565000000 | 648200000 |
| Monday, January 1, 2018 | 3548000000 | 743500000 |
| Tuesday, January 1, 2019 | 3583000000 | 756100000 |
| Wednesday, January 1, 2020 | 3075000000 | 676300000 |
| Friday, January 1, 2021 | 3256000000 | 619200000 |
| Saturday, January 1, 2022 | 3227000000 | 762500000 |
| Sunday, January 1, 2023 | 3795000000 | 848600000 |
| Monday, January 1, 2024 | 4077000000 | 812500000 |
Unlocking the unknown
In the competitive landscape of industrial manufacturing, operational efficiency is paramount. Over the past decade, Eaton Corporation plc and Hubbell Incorporated have demonstrated distinct strategies in managing their Selling, General, and Administrative (SG&A) expenses. Eaton's SG&A expenses have shown a slight decline, averaging around $3.5 billion annually, with a notable dip in 2020, likely due to pandemic-related adjustments. In contrast, Hubbell's SG&A expenses have steadily increased, reflecting a growth strategy, with a 43% rise from 2014 to 2023. This divergence highlights Eaton's focus on cost containment versus Hubbell's investment in expansion. As the industry evolves, these trends offer insights into each company's strategic priorities and operational resilience. Understanding these patterns is crucial for stakeholders aiming to gauge future performance and market positioning.
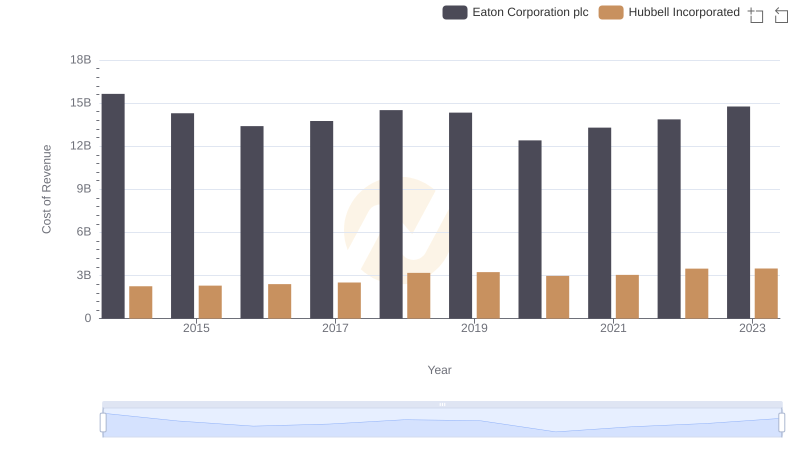
Eaton Corporation plc vs Hubbell Incorporated: Efficiency in Cost of Revenue Explored
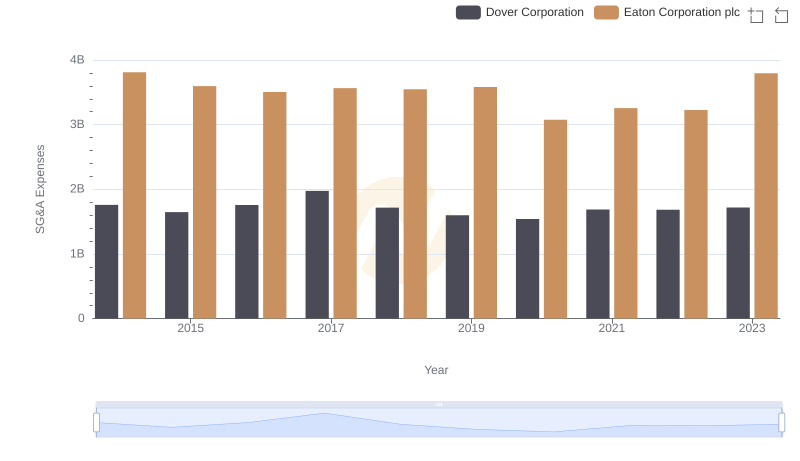
Comparing SG&A Expenses: Eaton Corporation plc vs Dover Corporation Trends and Insights

Operational Costs Compared: SG&A Analysis of Eaton Corporation plc and Lennox International Inc.
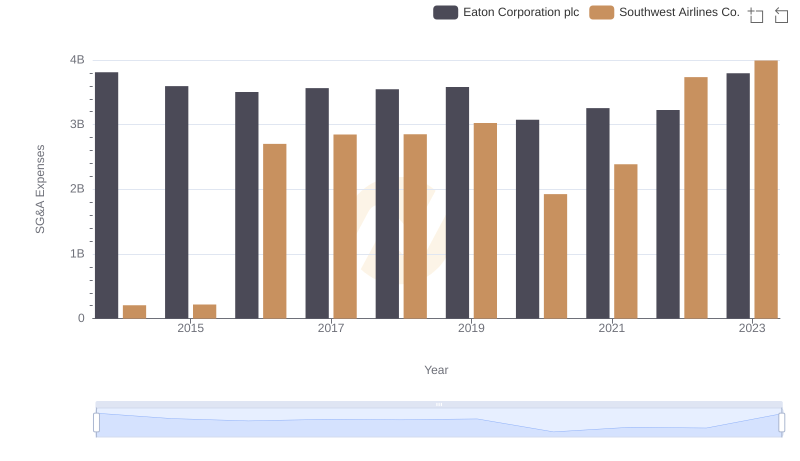
Eaton Corporation plc or Southwest Airlines Co.: Who Manages SG&A Costs Better?
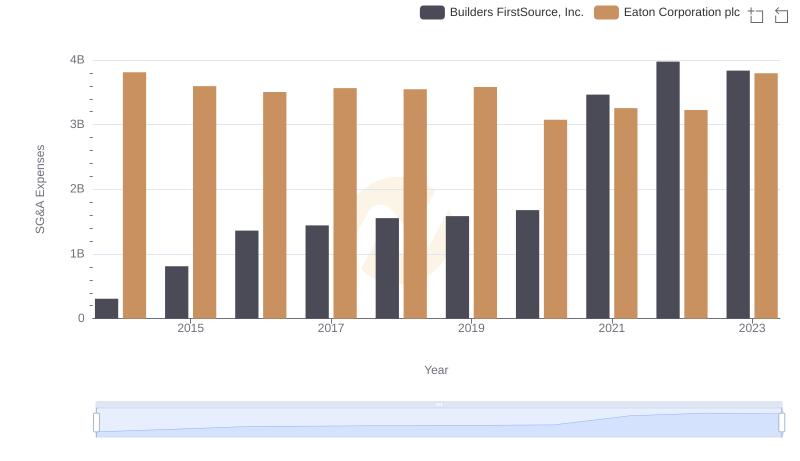
Cost Management Insights: SG&A Expenses for Eaton Corporation plc and Builders FirstSource, Inc.
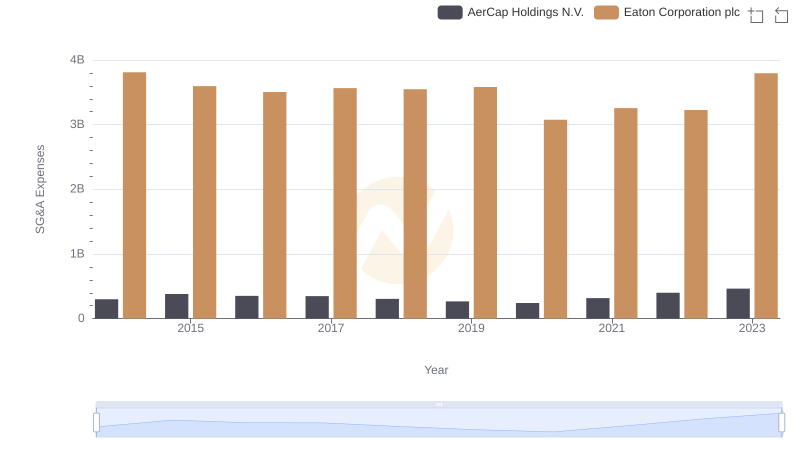
Who Optimizes SG&A Costs Better? Eaton Corporation plc or AerCap Holdings N.V.