| __timestamp | Eaton Corporation plc | Lennox International Inc. |
|---|---|---|
| Wednesday, January 1, 2014 | 3586000000 | 387700000 |
| Thursday, January 1, 2015 | 3302000000 | 423600000 |
| Friday, January 1, 2016 | 3176000000 | 490800000 |
| Sunday, January 1, 2017 | 3418000000 | 562900000 |
| Monday, January 1, 2018 | 3875000000 | 575200000 |
| Tuesday, January 1, 2019 | 2827000000 | 633300000 |
| Wednesday, January 1, 2020 | 1674000000 | 553900000 |
| Friday, January 1, 2021 | 2423000000 | 652500000 |
| Saturday, January 1, 2022 | 3031000000 | 729000000 |
| Sunday, January 1, 2023 | 4904000000 | 879500000 |
| Monday, January 1, 2024 | 5547999771 | 1034800000 |
Unleashing the power of data
In the ever-evolving landscape of industrial giants, Eaton Corporation plc and Lennox International Inc. have showcased intriguing EBITDA trends over the past decade. From 2014 to 2023, Eaton's EBITDA fluctuated, peaking in 2023 with a remarkable 54% increase from its 2014 figures. In contrast, Lennox International Inc. demonstrated steady growth, achieving a 127% rise in EBITDA by 2023 compared to 2014.
Eaton's performance saw a dip in 2020, likely due to global economic challenges, but rebounded strongly in subsequent years. Meanwhile, Lennox's consistent upward trajectory highlights its resilience and strategic prowess in the market. Notably, 2024 data for Eaton is missing, leaving room for speculation on its future performance.
This comparative analysis not only underscores the dynamic nature of these corporations but also offers valuable insights for investors and industry enthusiasts alike.
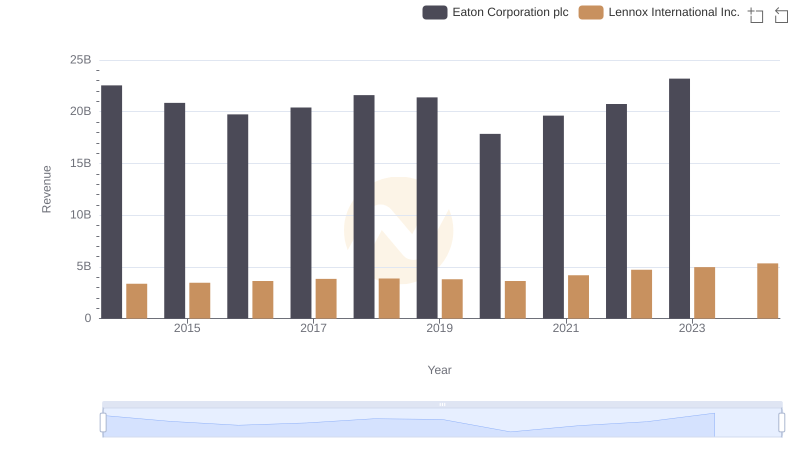
Revenue Insights: Eaton Corporation plc and Lennox International Inc. Performance Compared
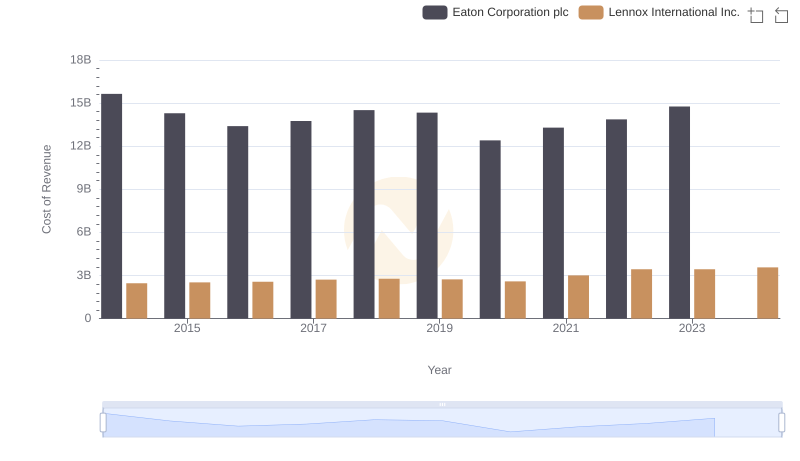
Analyzing Cost of Revenue: Eaton Corporation plc and Lennox International Inc.
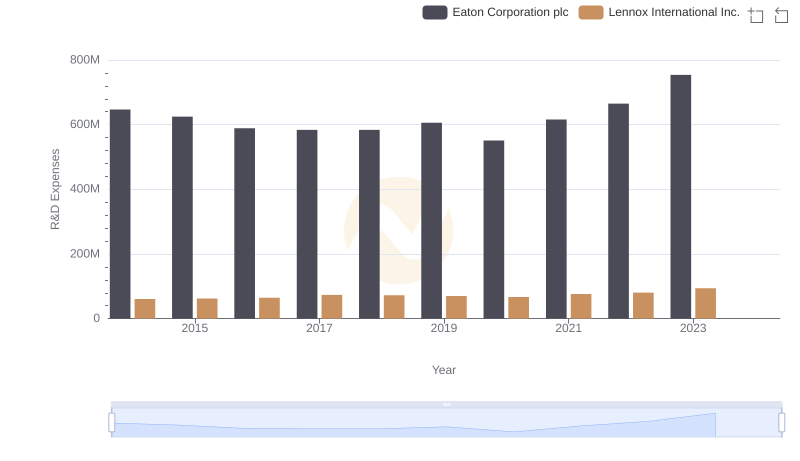
Comparing Innovation Spending: Eaton Corporation plc and Lennox International Inc.

Operational Costs Compared: SG&A Analysis of Eaton Corporation plc and Lennox International Inc.
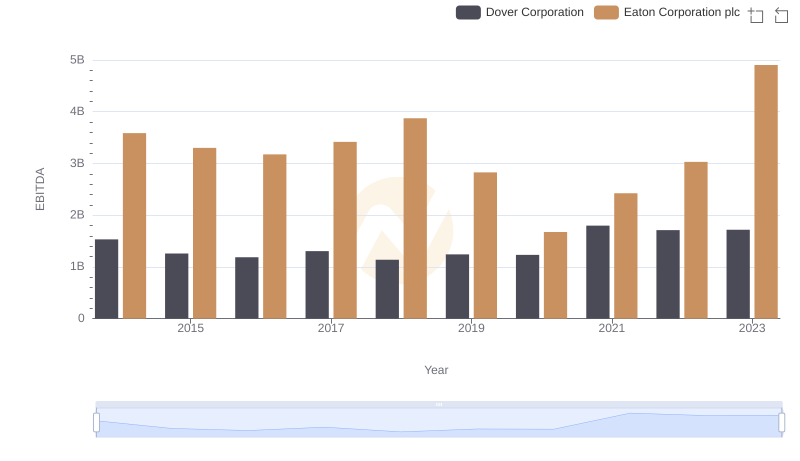
Comparative EBITDA Analysis: Eaton Corporation plc vs Dover Corporation
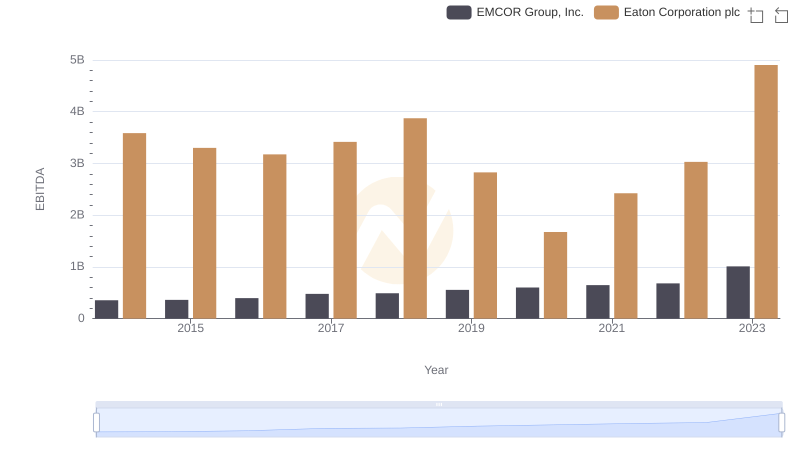
Eaton Corporation plc and EMCOR Group, Inc.: A Detailed Examination of EBITDA Performance
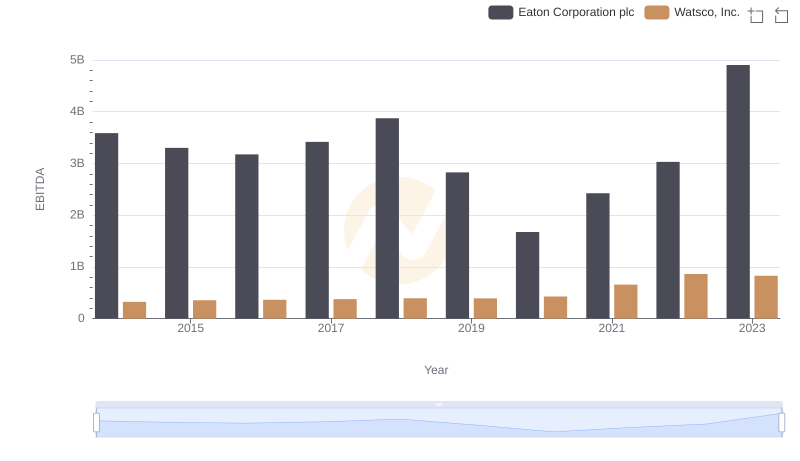
Professional EBITDA Benchmarking: Eaton Corporation plc vs Watsco, Inc.
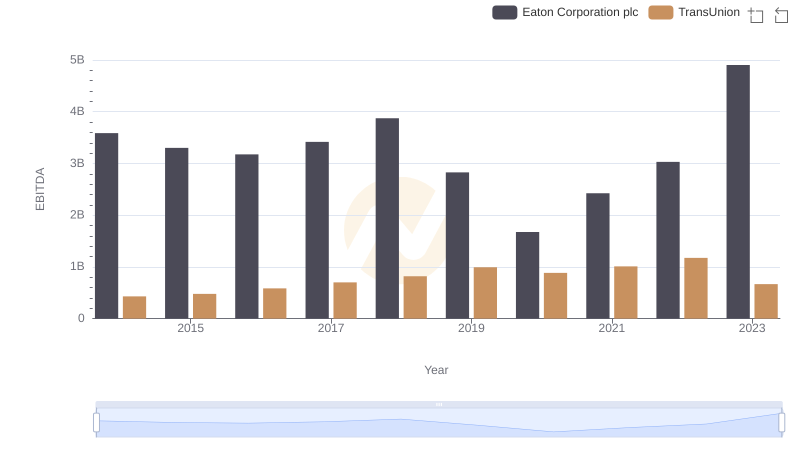
Eaton Corporation plc vs TransUnion: In-Depth EBITDA Performance Comparison