| __timestamp | Eaton Corporation plc | Lennox International Inc. |
|---|---|---|
| Wednesday, January 1, 2014 | 647000000 | 60700000 |
| Thursday, January 1, 2015 | 625000000 | 62300000 |
| Friday, January 1, 2016 | 589000000 | 64599999 |
| Sunday, January 1, 2017 | 584000000 | 73600000 |
| Monday, January 1, 2018 | 584000000 | 72200000 |
| Tuesday, January 1, 2019 | 606000000 | 69900000 |
| Wednesday, January 1, 2020 | 551000000 | 66800000 |
| Friday, January 1, 2021 | 616000000 | 76100000 |
| Saturday, January 1, 2022 | 665000000 | 80300000 |
| Sunday, January 1, 2023 | 754000000 | 94000000 |
| Monday, January 1, 2024 | 794000000 | 0 |
Unleashing insights
In the competitive landscape of industrial innovation, Eaton Corporation plc and Lennox International Inc. have charted distinct paths over the past decade. Eaton, a leader in power management, consistently allocated a significant portion of its resources to research and development, with expenditures peaking at approximately 754 million in 2023. This represents a robust 16% increase from 2014, underscoring Eaton's commitment to innovation.
Conversely, Lennox International, a key player in climate control solutions, demonstrated a more modest yet steady investment in R&D. Their spending grew by about 55% from 2014 to 2023, reaching nearly 94 million. This strategic allocation reflects Lennox's focus on enhancing product efficiency and sustainability.
While Eaton's R&D spending dwarfs that of Lennox, both companies showcase a dedication to innovation, albeit on different scales. The data for 2024 remains incomplete, leaving room for speculation on future trends.

Research and Development Expenses Breakdown: Eaton Corporation plc vs Ingersoll Rand Inc.
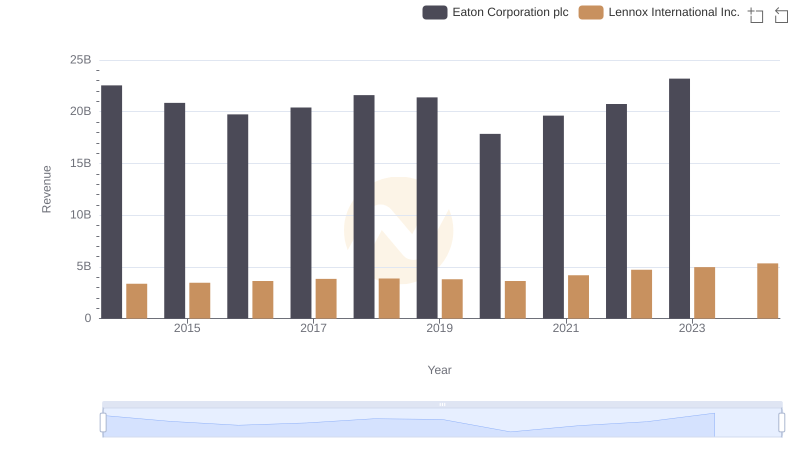
Revenue Insights: Eaton Corporation plc and Lennox International Inc. Performance Compared
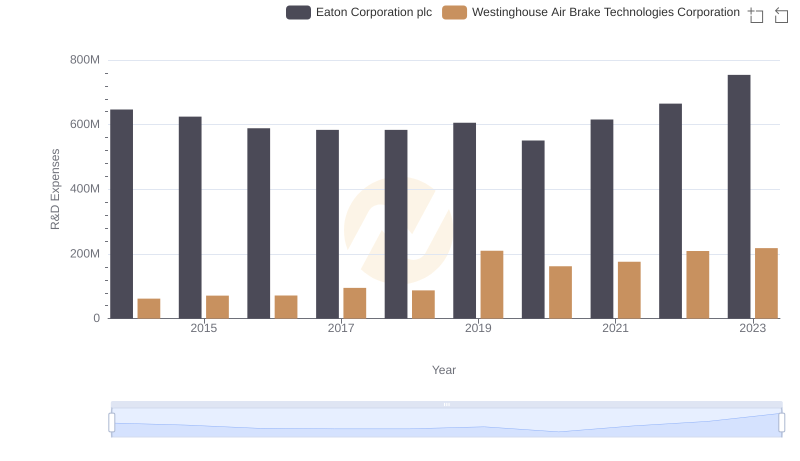
Research and Development Investment: Eaton Corporation plc vs Westinghouse Air Brake Technologies Corporation
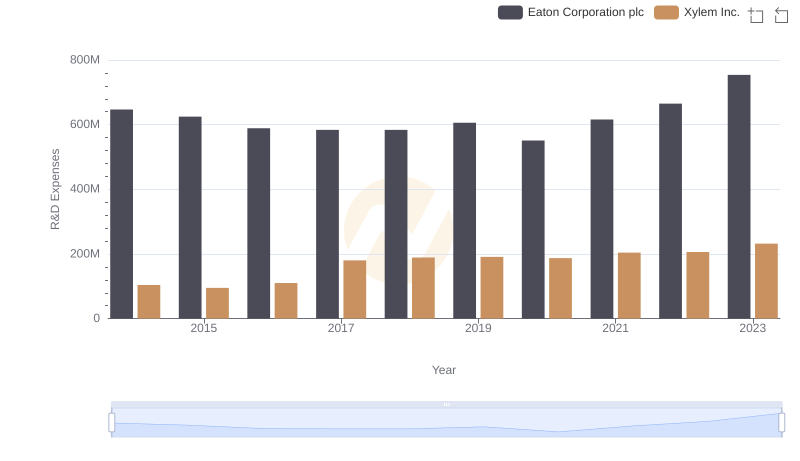
Research and Development Investment: Eaton Corporation plc vs Xylem Inc.
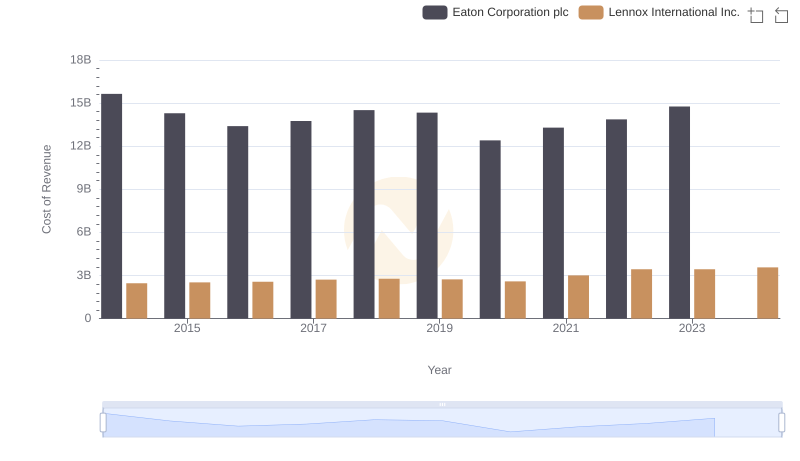
Analyzing Cost of Revenue: Eaton Corporation plc and Lennox International Inc.
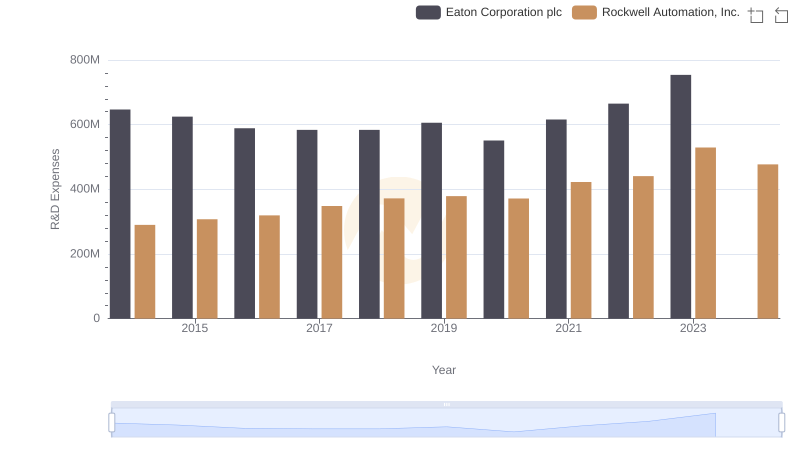
Comparing Innovation Spending: Eaton Corporation plc and Rockwell Automation, Inc.

Operational Costs Compared: SG&A Analysis of Eaton Corporation plc and Lennox International Inc.
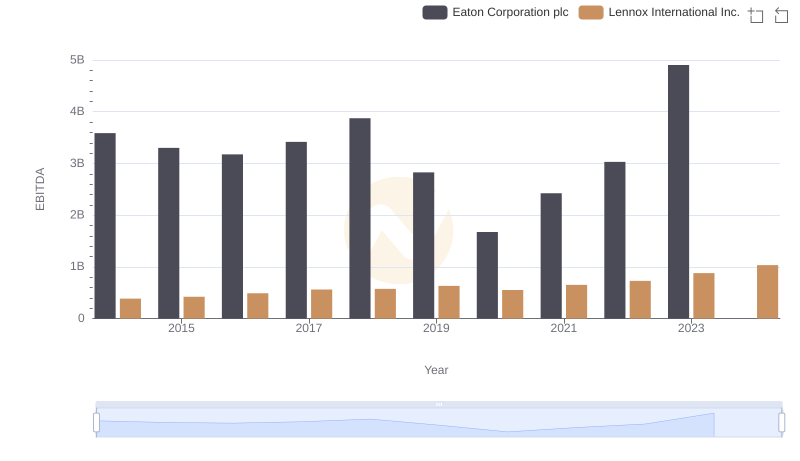
Eaton Corporation plc vs Lennox International Inc.: In-Depth EBITDA Performance Comparison
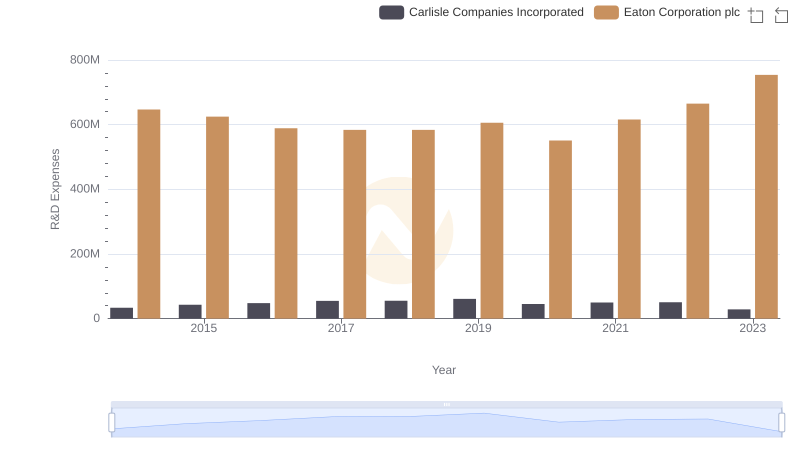
R&D Insights: How Eaton Corporation plc and Carlisle Companies Incorporated Allocate Funds