| __timestamp | Cisco Systems, Inc. | Intel Corporation |
|---|---|---|
| Wednesday, January 1, 2014 | 27769000000 | 35609000000 |
| Thursday, January 1, 2015 | 29681000000 | 34679000000 |
| Friday, January 1, 2016 | 30960000000 | 36191000000 |
| Sunday, January 1, 2017 | 30224000000 | 39069000000 |
| Monday, January 1, 2018 | 30606000000 | 43737000000 |
| Tuesday, January 1, 2019 | 32666000000 | 42140000000 |
| Wednesday, January 1, 2020 | 31683000000 | 43612000000 |
| Friday, January 1, 2021 | 31894000000 | 43815000000 |
| Saturday, January 1, 2022 | 32248000000 | 26866000000 |
| Sunday, January 1, 2023 | 35753000000 | 21711000000 |
| Monday, January 1, 2024 | 34828000000 | 17345000000 |
Unlocking the unknown
In the ever-evolving tech industry, Cisco Systems, Inc. and Intel Corporation have been titans of innovation and profitability. From 2014 to 2023, these giants have showcased their financial prowess through gross profit performance. Cisco's gross profit has seen a steady climb, peaking in 2023 with a remarkable 29% increase from its 2014 figures. Meanwhile, Intel's journey has been more volatile, with a notable peak in 2021, followed by a sharp decline in 2023, dropping by nearly 50% from its 2021 high.
As we look to the future, these trends offer valuable insights into the strategic directions and market dynamics of these tech leaders.
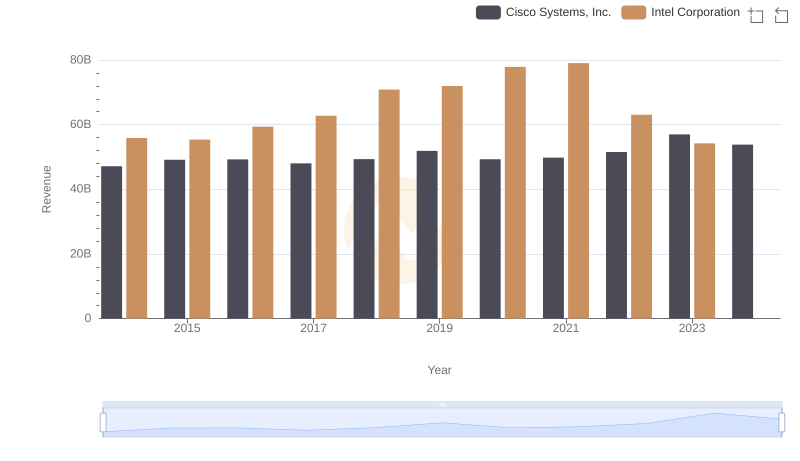
Revenue Showdown: Cisco Systems, Inc. vs Intel Corporation
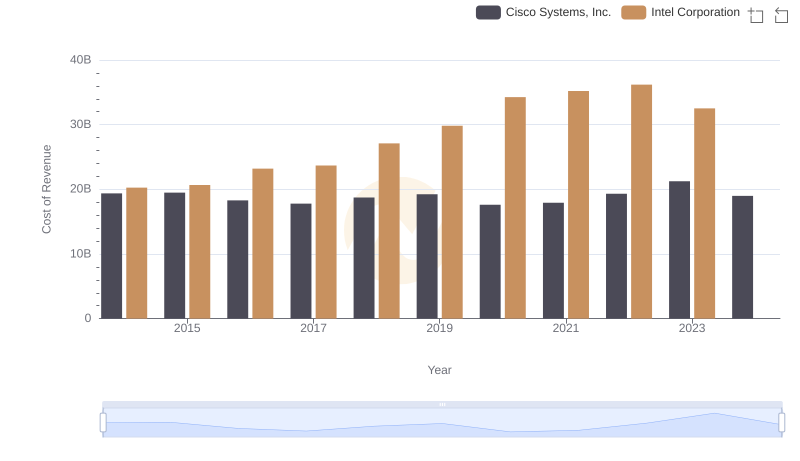
Comparing Cost of Revenue Efficiency: Cisco Systems, Inc. vs Intel Corporation
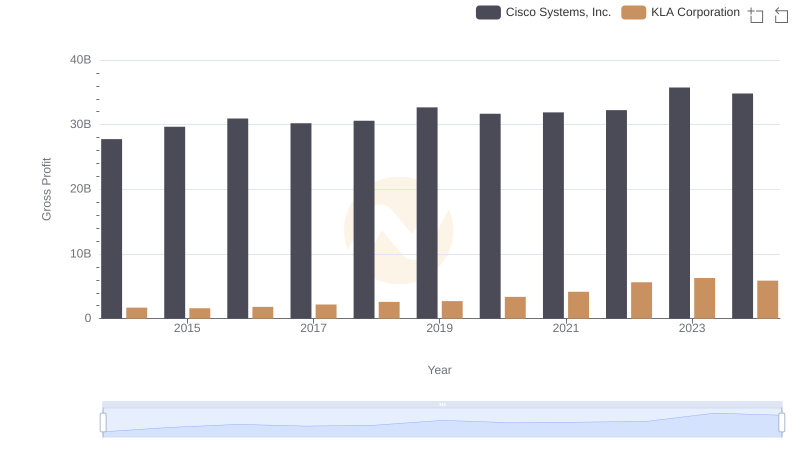
Gross Profit Comparison: Cisco Systems, Inc. and KLA Corporation Trends
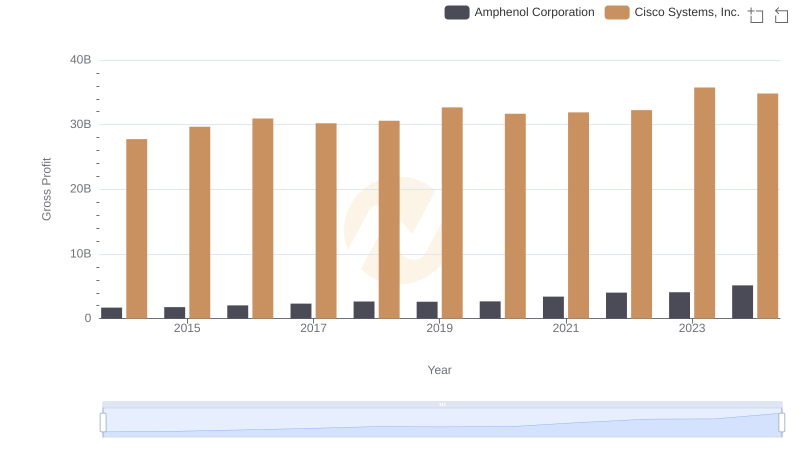
Key Insights on Gross Profit: Cisco Systems, Inc. vs Amphenol Corporation
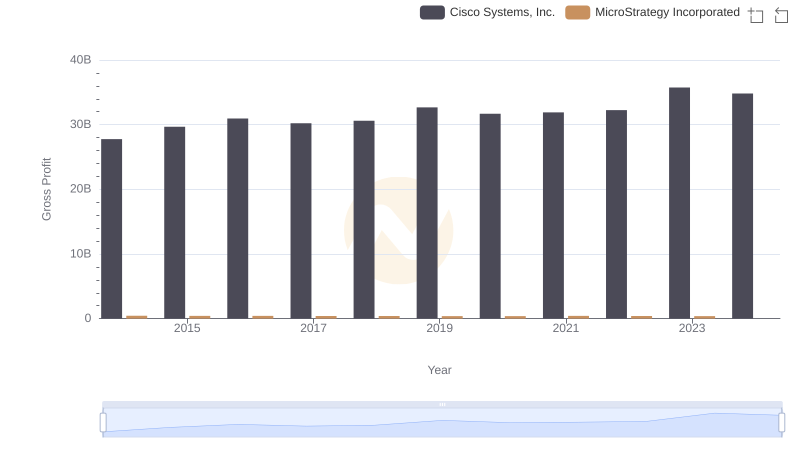
Cisco Systems, Inc. vs MicroStrategy Incorporated: A Gross Profit Performance Breakdown
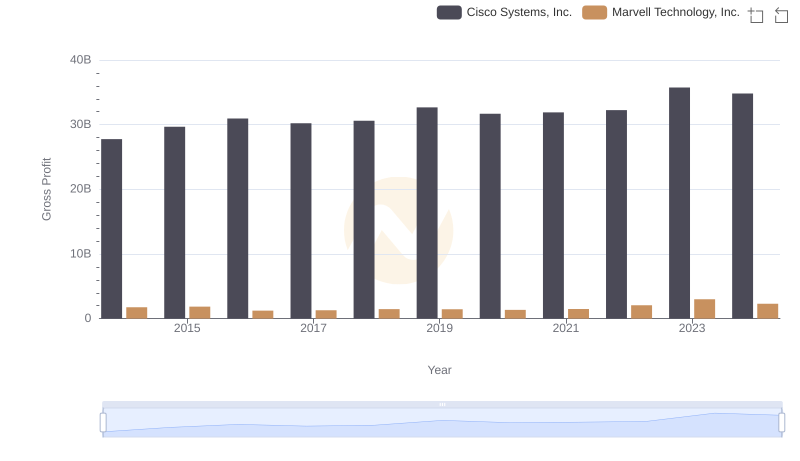
Cisco Systems, Inc. vs Marvell Technology, Inc.: A Gross Profit Performance Breakdown
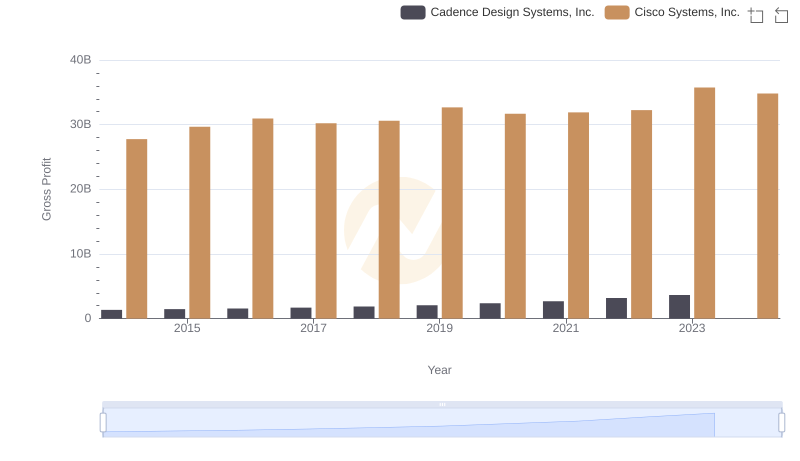
Gross Profit Analysis: Comparing Cisco Systems, Inc. and Cadence Design Systems, Inc.
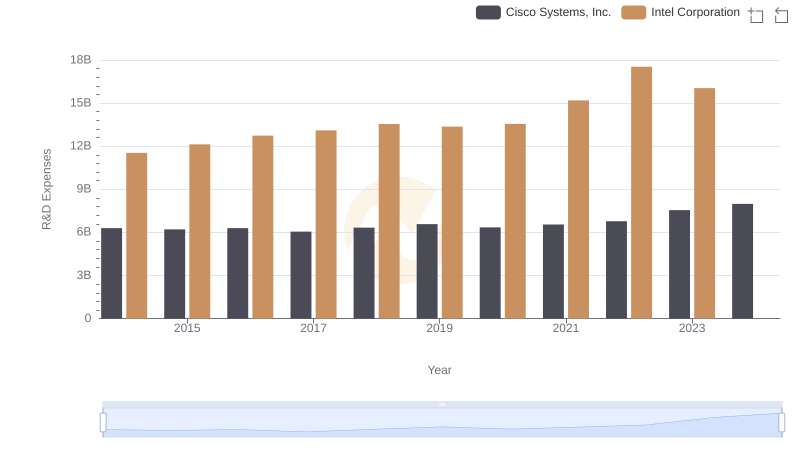
R&D Insights: How Cisco Systems, Inc. and Intel Corporation Allocate Funds
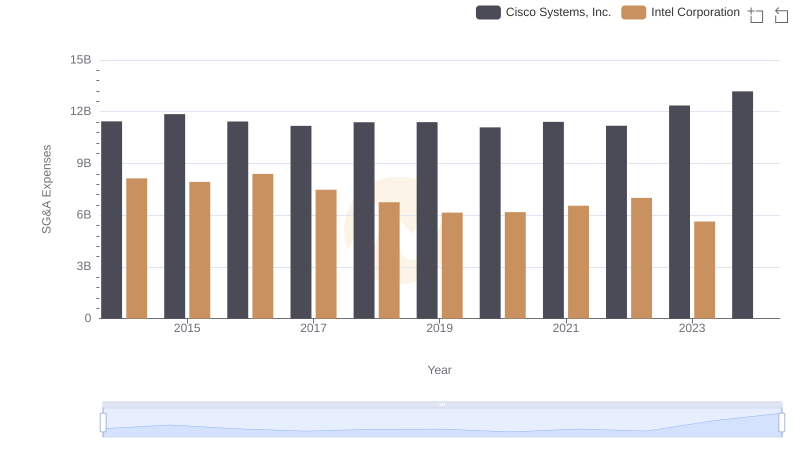
Operational Costs Compared: SG&A Analysis of Cisco Systems, Inc. and Intel Corporation
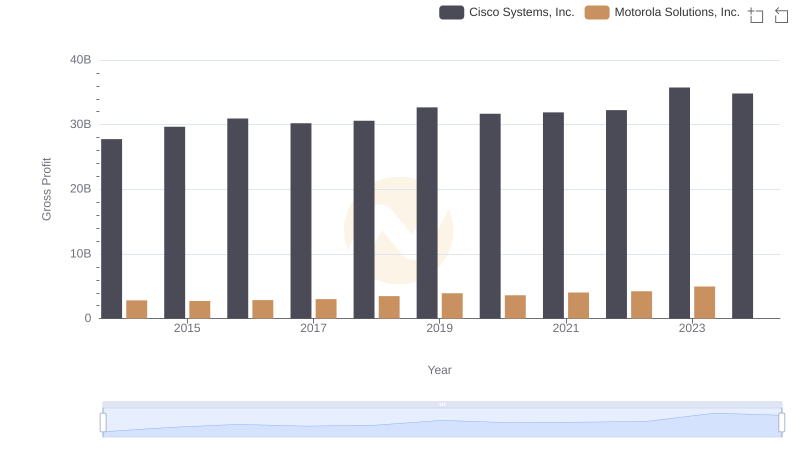
Cisco Systems, Inc. and Motorola Solutions, Inc.: A Detailed Gross Profit Analysis
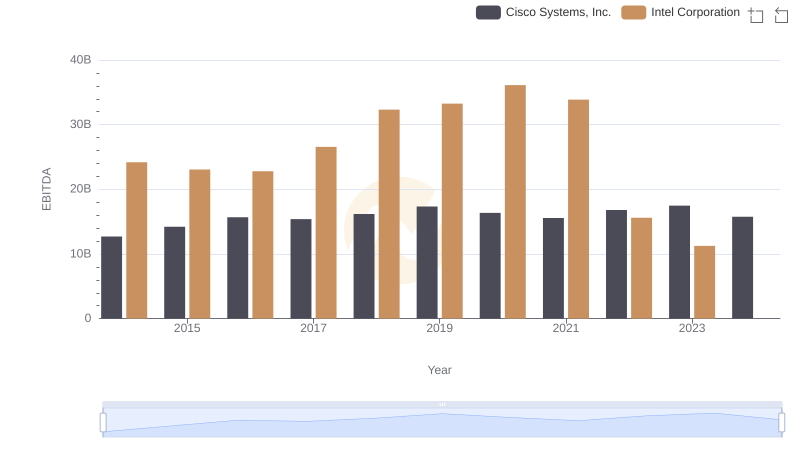
EBITDA Metrics Evaluated: Cisco Systems, Inc. vs Intel Corporation