| __timestamp | Cisco Systems, Inc. | Intel Corporation |
|---|---|---|
| Wednesday, January 1, 2014 | 19373000000 | 20261000000 |
| Thursday, January 1, 2015 | 19480000000 | 20676000000 |
| Friday, January 1, 2016 | 18287000000 | 23196000000 |
| Sunday, January 1, 2017 | 17781000000 | 23692000000 |
| Monday, January 1, 2018 | 18724000000 | 27111000000 |
| Tuesday, January 1, 2019 | 19238000000 | 29825000000 |
| Wednesday, January 1, 2020 | 17618000000 | 34255000000 |
| Friday, January 1, 2021 | 17924000000 | 35209000000 |
| Saturday, January 1, 2022 | 19309000000 | 36188000000 |
| Sunday, January 1, 2023 | 21245000000 | 32517000000 |
| Monday, January 1, 2024 | 18975000000 | 35756000000 |
Unlocking the unknown
In the ever-evolving tech industry, cost efficiency is a critical metric for success. Over the past decade, Cisco Systems, Inc. and Intel Corporation have demonstrated contrasting trends in their cost of revenue. From 2014 to 2023, Cisco's cost of revenue fluctuated modestly, peaking in 2023 with a 10% increase from its 2014 value. In contrast, Intel's cost of revenue surged by nearly 80% from 2014 to 2022, reflecting its aggressive expansion and market adaptation strategies. However, 2023 saw a notable decline, indicating potential shifts in Intel's operational strategies or market conditions. This comparison highlights the dynamic nature of cost management in tech giants, where strategic decisions significantly impact financial outcomes. As we look forward, the absence of 2024 data for Intel suggests a period of uncertainty, inviting speculation on its future cost efficiency strategies.
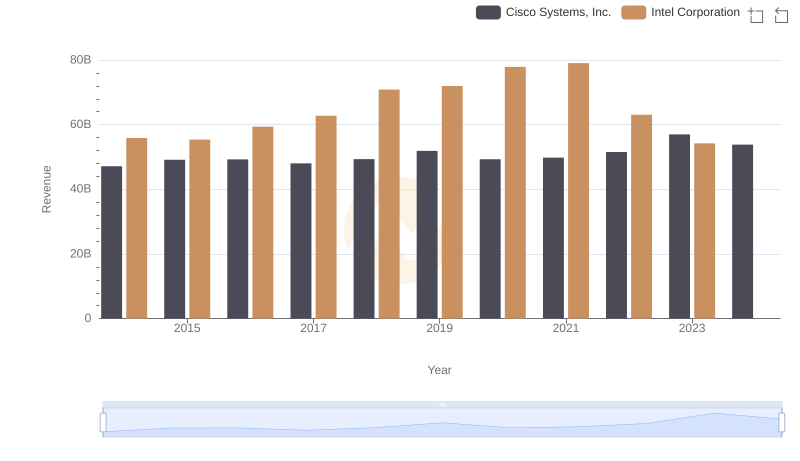
Revenue Showdown: Cisco Systems, Inc. vs Intel Corporation
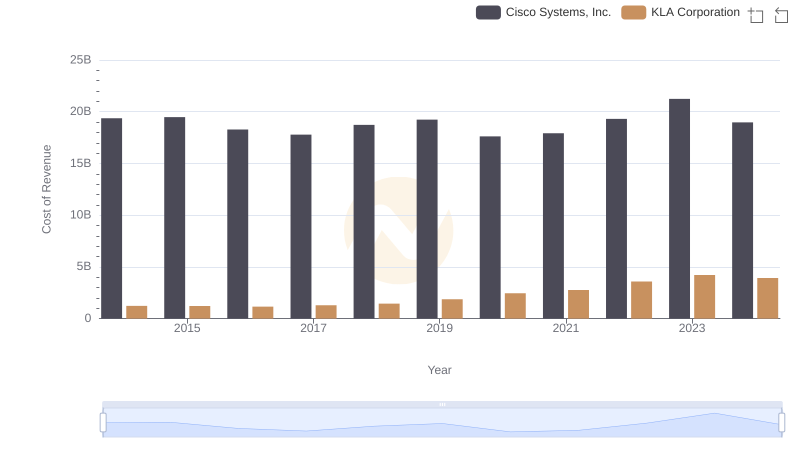
Cisco Systems, Inc. vs KLA Corporation: Efficiency in Cost of Revenue Explored
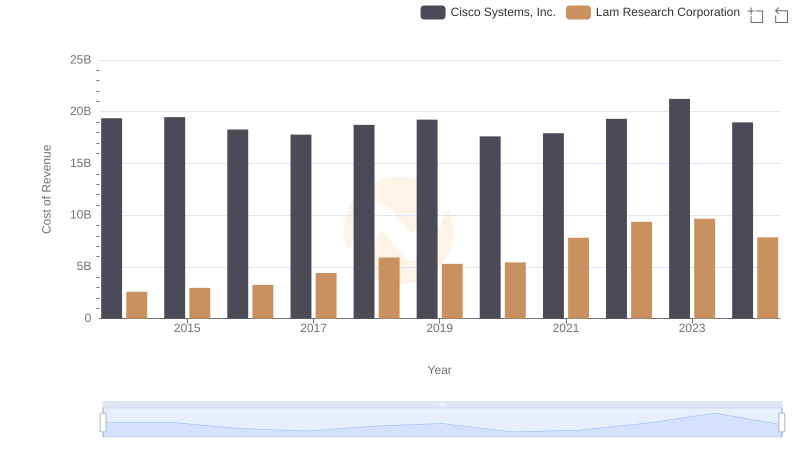
Analyzing Cost of Revenue: Cisco Systems, Inc. and Lam Research Corporation
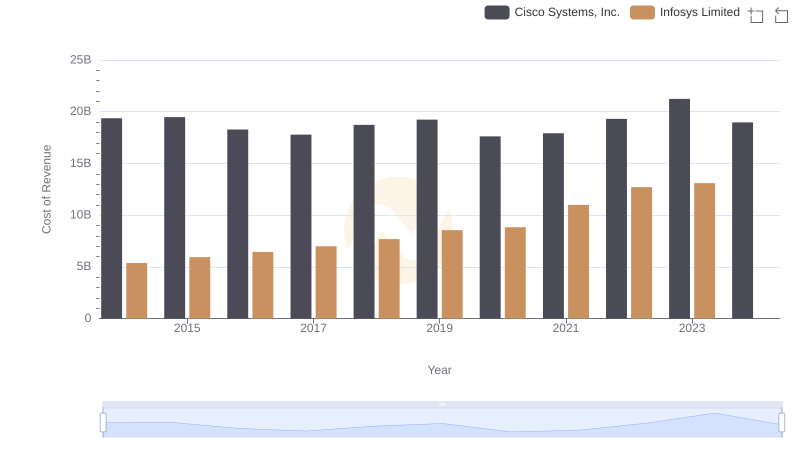
Cost of Revenue: Key Insights for Cisco Systems, Inc. and Infosys Limited
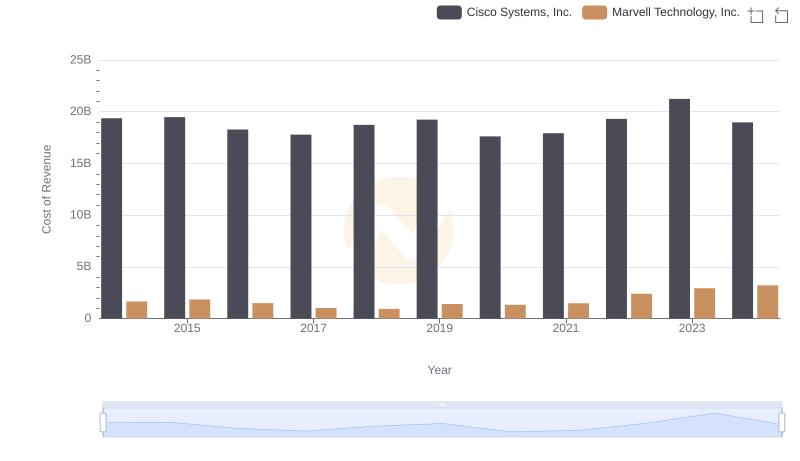
Comparing Cost of Revenue Efficiency: Cisco Systems, Inc. vs Marvell Technology, Inc.
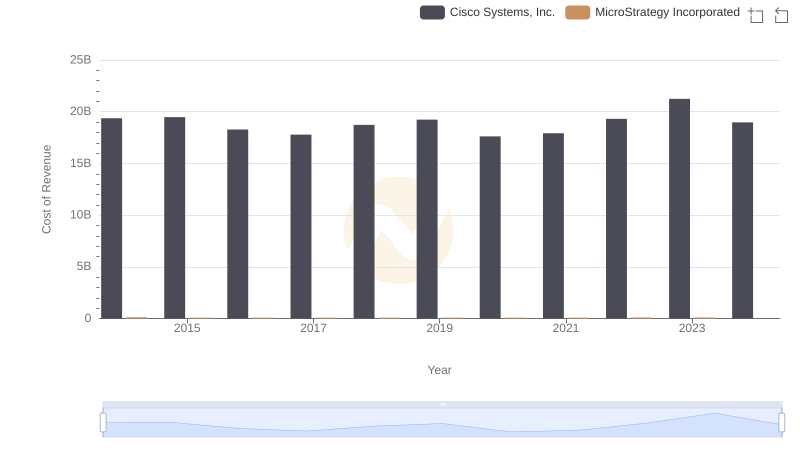
Cost of Revenue: Key Insights for Cisco Systems, Inc. and MicroStrategy Incorporated
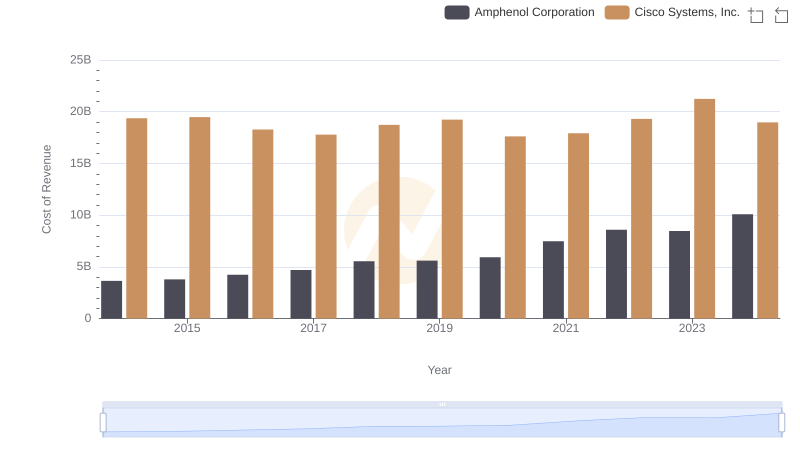
Cost of Revenue Trends: Cisco Systems, Inc. vs Amphenol Corporation
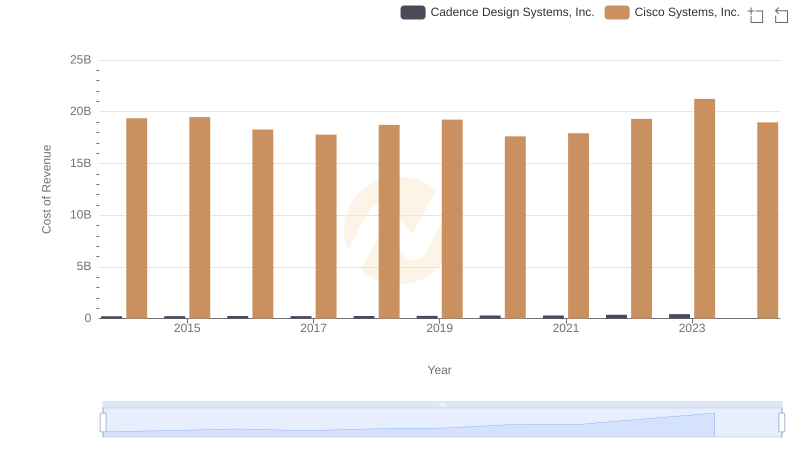
Cost of Revenue: Key Insights for Cisco Systems, Inc. and Cadence Design Systems, Inc.
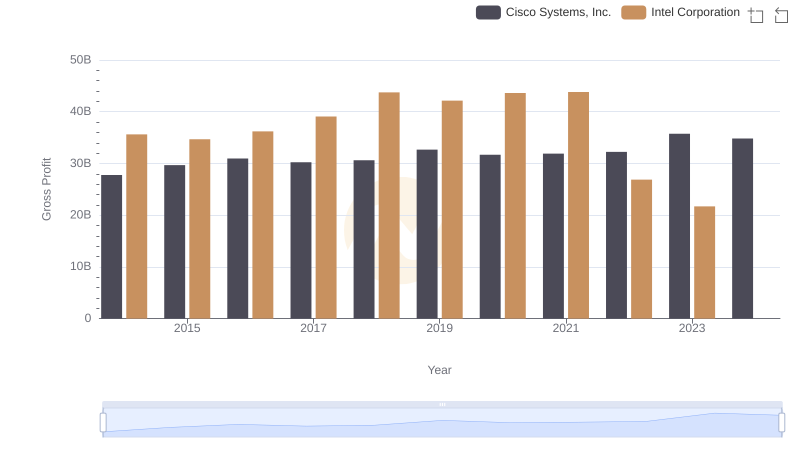
Cisco Systems, Inc. vs Intel Corporation: A Gross Profit Performance Breakdown
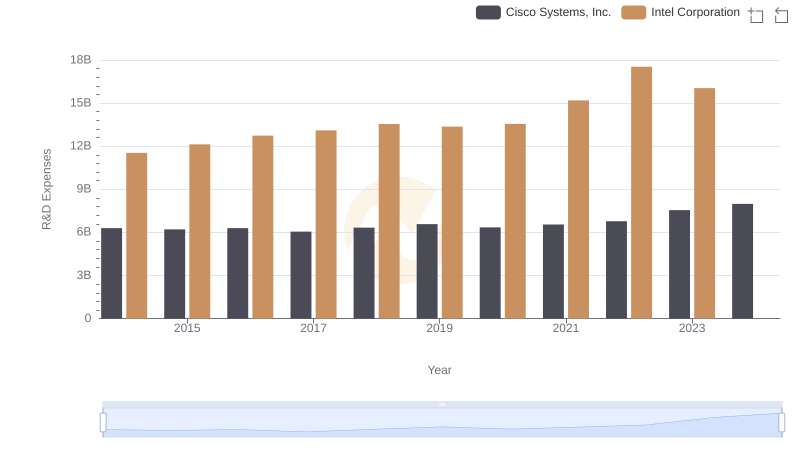
R&D Insights: How Cisco Systems, Inc. and Intel Corporation Allocate Funds
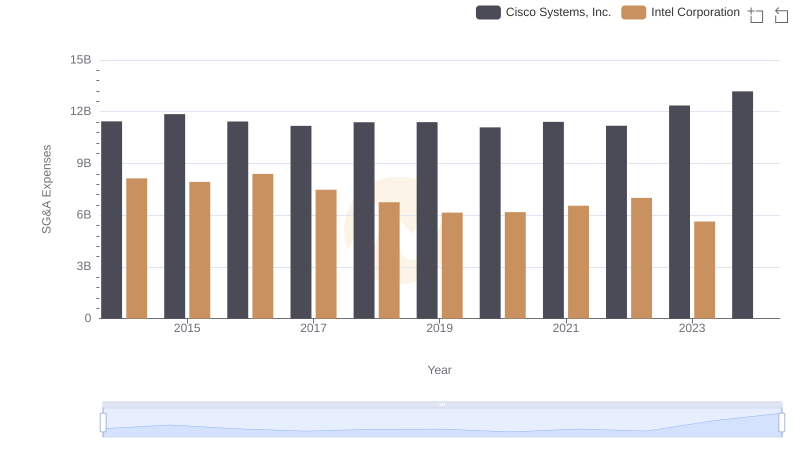
Operational Costs Compared: SG&A Analysis of Cisco Systems, Inc. and Intel Corporation
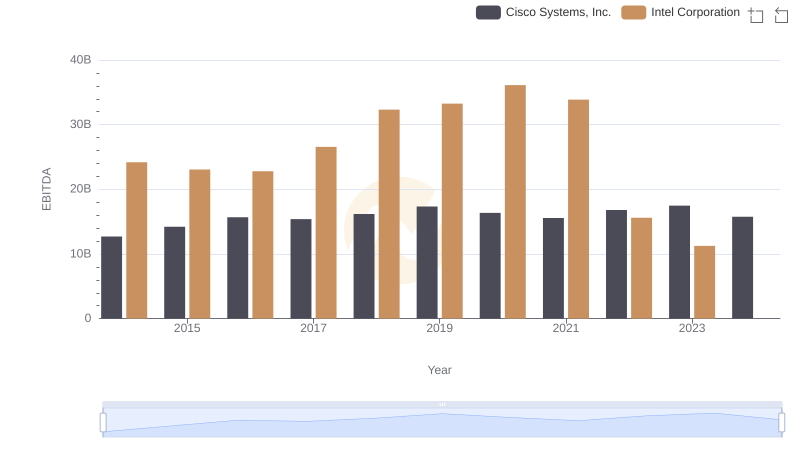
EBITDA Metrics Evaluated: Cisco Systems, Inc. vs Intel Corporation