| __timestamp | Old Dominion Freight Line, Inc. | TFI International Inc. |
|---|---|---|
| Wednesday, January 1, 2014 | 585590000 | 334908602 |
| Thursday, January 1, 2015 | 660570000 | 314924803 |
| Friday, January 1, 2016 | 671786000 | 325584405 |
| Sunday, January 1, 2017 | 783749000 | 517899005 |
| Monday, January 1, 2018 | 1046059000 | 521265317 |
| Tuesday, January 1, 2019 | 1078007000 | 674440000 |
| Wednesday, January 1, 2020 | 1168149000 | 709296000 |
| Friday, January 1, 2021 | 1651501000 | 1358717000 |
| Saturday, January 1, 2022 | 2118962000 | 1561728000 |
| Sunday, January 1, 2023 | 1972689000 | 1194213000 |
Infusing magic into the data realm
In the competitive world of freight and logistics, two giants stand out: Old Dominion Freight Line, Inc. and TFI International Inc. Over the past decade, these companies have showcased remarkable EBITDA growth, reflecting their operational efficiency and market adaptability.
From 2014 to 2023, Old Dominion Freight Line, Inc. saw its EBITDA soar by approximately 237%, peaking in 2022. Meanwhile, TFI International Inc. experienced a robust 270% increase, with its highest EBITDA recorded in the same year. Notably, Old Dominion consistently outperformed TFI in absolute EBITDA terms, highlighting its dominant market position.
The year 2021 marked a significant turning point, with both companies achieving their highest year-over-year growth rates, driven by increased demand and strategic expansions. As the logistics landscape evolves, these industry leaders continue to set benchmarks in financial performance and operational excellence.
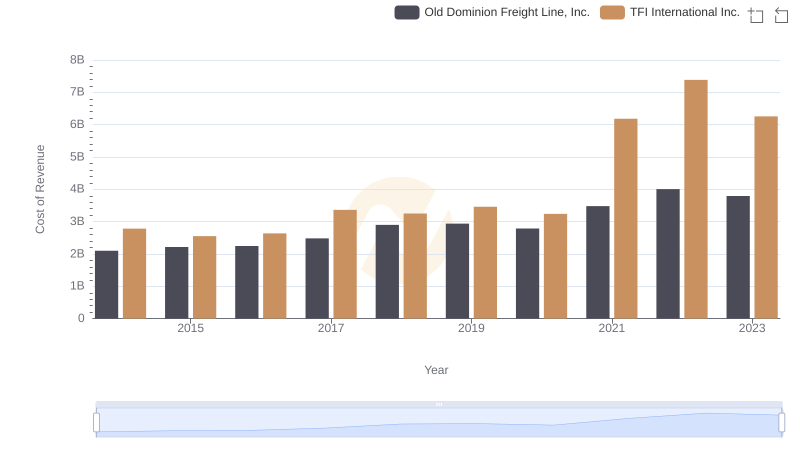
Cost of Revenue: Key Insights for Old Dominion Freight Line, Inc. and TFI International Inc.
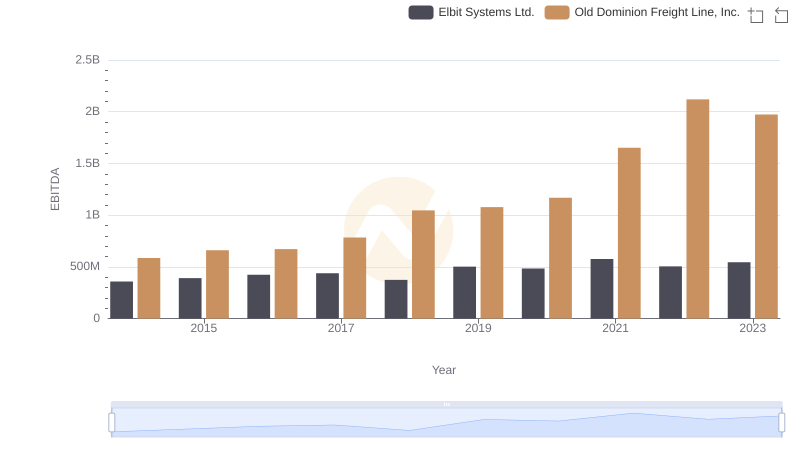
Comparative EBITDA Analysis: Old Dominion Freight Line, Inc. vs Elbit Systems Ltd.
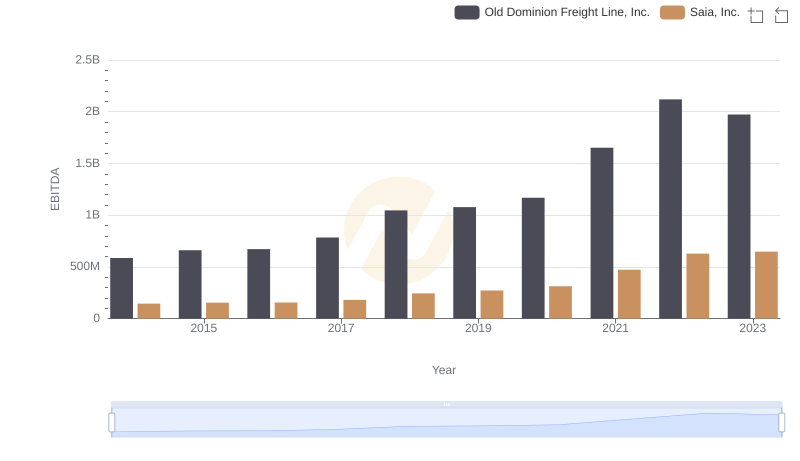
Comprehensive EBITDA Comparison: Old Dominion Freight Line, Inc. vs Saia, Inc.
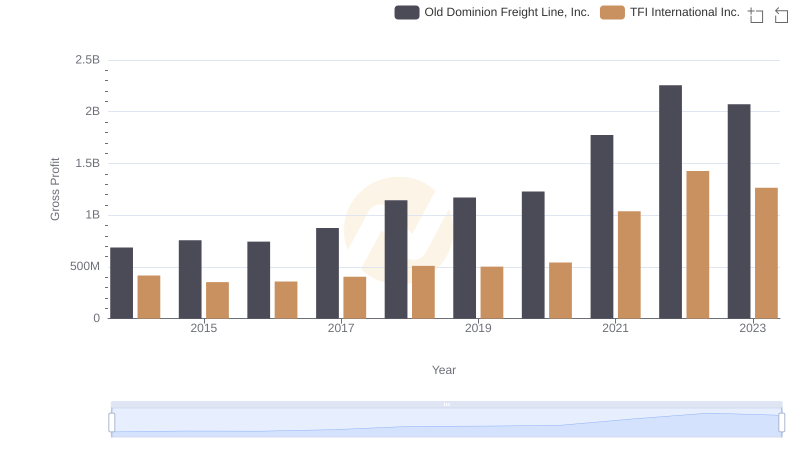
Gross Profit Analysis: Comparing Old Dominion Freight Line, Inc. and TFI International Inc.
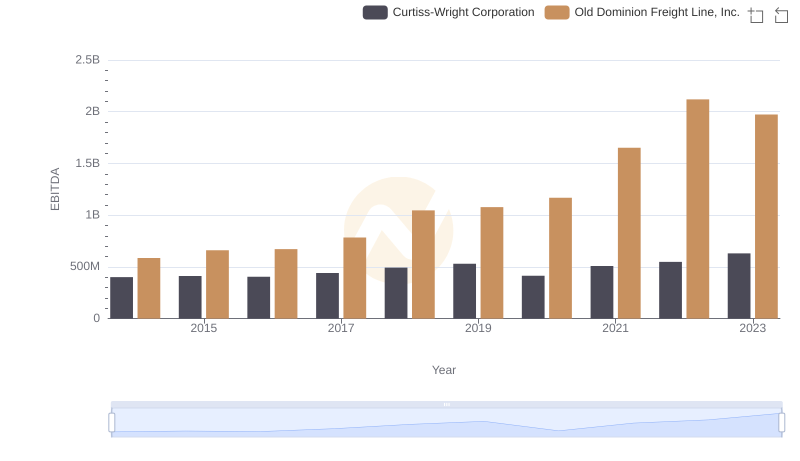
Professional EBITDA Benchmarking: Old Dominion Freight Line, Inc. vs Curtiss-Wright Corporation
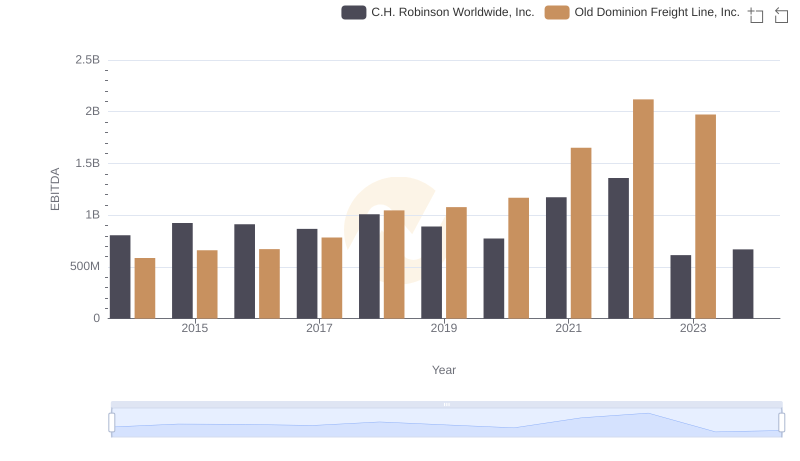
A Professional Review of EBITDA: Old Dominion Freight Line, Inc. Compared to C.H. Robinson Worldwide, Inc.
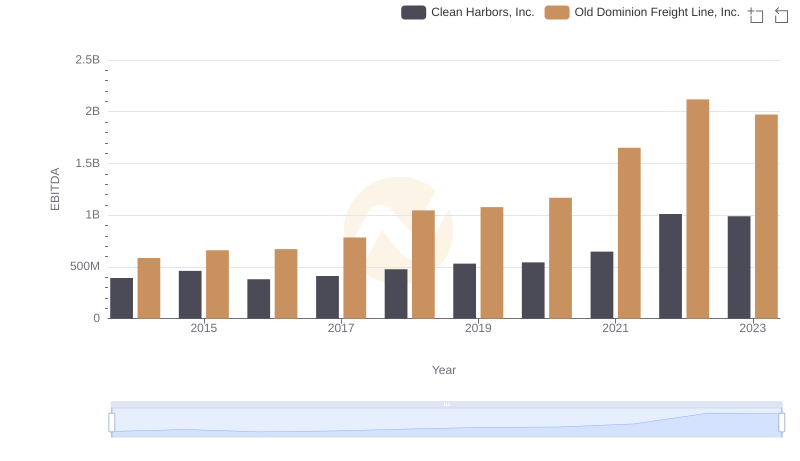
A Side-by-Side Analysis of EBITDA: Old Dominion Freight Line, Inc. and Clean Harbors, Inc.
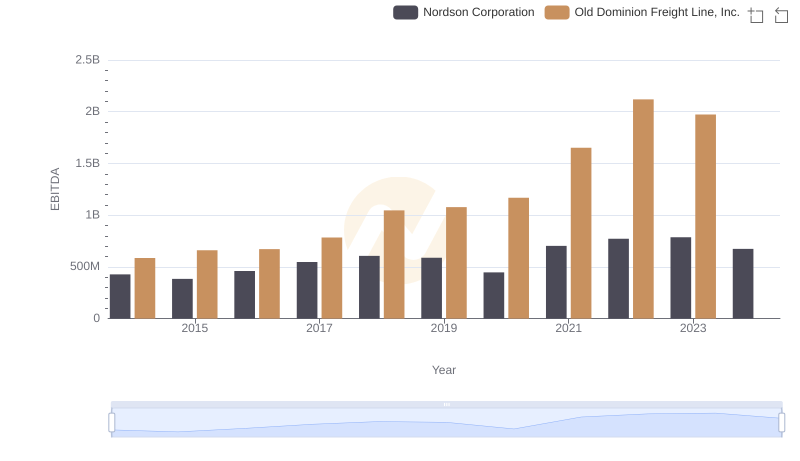
Comprehensive EBITDA Comparison: Old Dominion Freight Line, Inc. vs Nordson Corporation
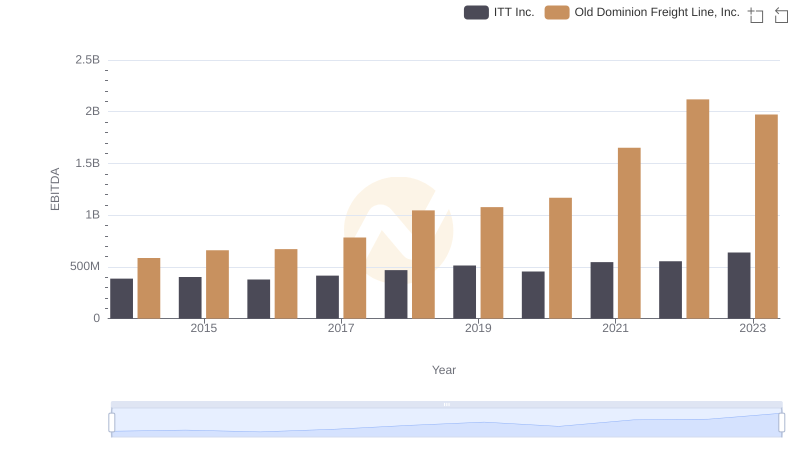
EBITDA Metrics Evaluated: Old Dominion Freight Line, Inc. vs ITT Inc.
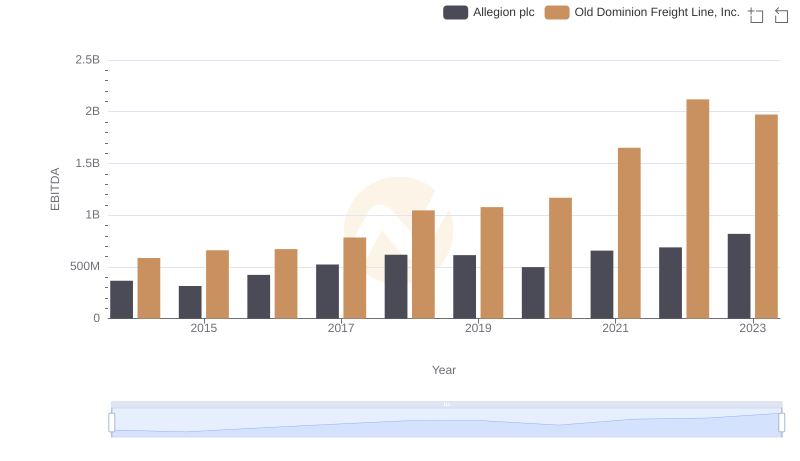
A Side-by-Side Analysis of EBITDA: Old Dominion Freight Line, Inc. and Allegion plc