| __timestamp | Nordson Corporation | Old Dominion Freight Line, Inc. |
|---|---|---|
| Wednesday, January 1, 2014 | 427302000 | 585590000 |
| Thursday, January 1, 2015 | 384160000 | 660570000 |
| Friday, January 1, 2016 | 460120000 | 671786000 |
| Sunday, January 1, 2017 | 547746000 | 783749000 |
| Monday, January 1, 2018 | 606502000 | 1046059000 |
| Tuesday, January 1, 2019 | 588493000 | 1078007000 |
| Wednesday, January 1, 2020 | 446951000 | 1168149000 |
| Friday, January 1, 2021 | 703550000 | 1651501000 |
| Saturday, January 1, 2022 | 771615000 | 2118962000 |
| Sunday, January 1, 2023 | 786742000 | 1972689000 |
| Monday, January 1, 2024 | 674001000 |
Unlocking the unknown
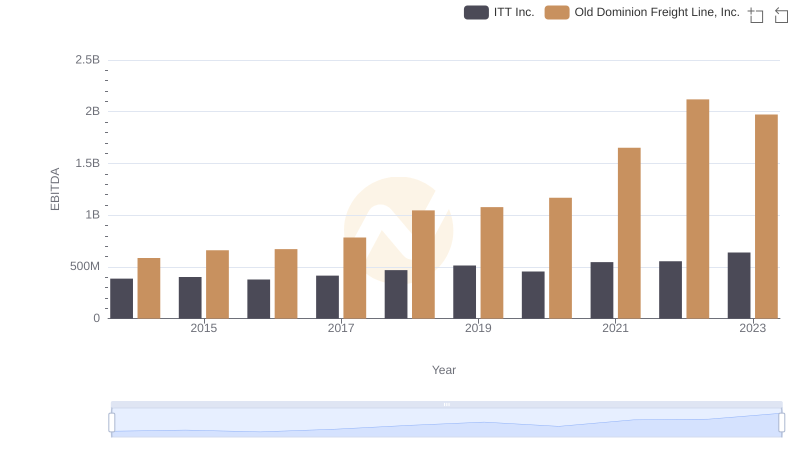
In the competitive landscape of American industry, Old Dominion Freight Line, Inc. and Nordson Corporation have showcased remarkable financial trajectories over the past decade. From 2014 to 2023, Old Dominion's EBITDA surged by an impressive 237%, peaking in 2022. This growth underscores the company's robust operational efficiency and strategic market positioning. Meanwhile, Nordson Corporation experienced a steady EBITDA increase of approximately 84% during the same period, reflecting its resilience and adaptability in the manufacturing sector.
These insights provide a compelling narrative of two industry giants navigating economic challenges and opportunities.
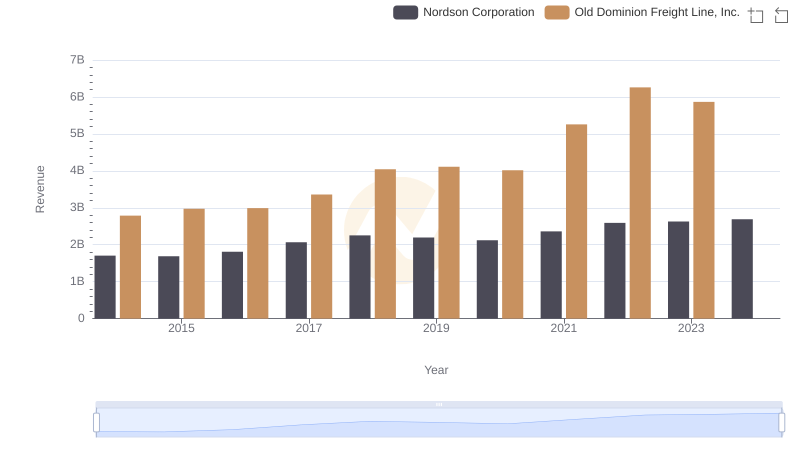
Old Dominion Freight Line, Inc. vs Nordson Corporation: Annual Revenue Growth Compared
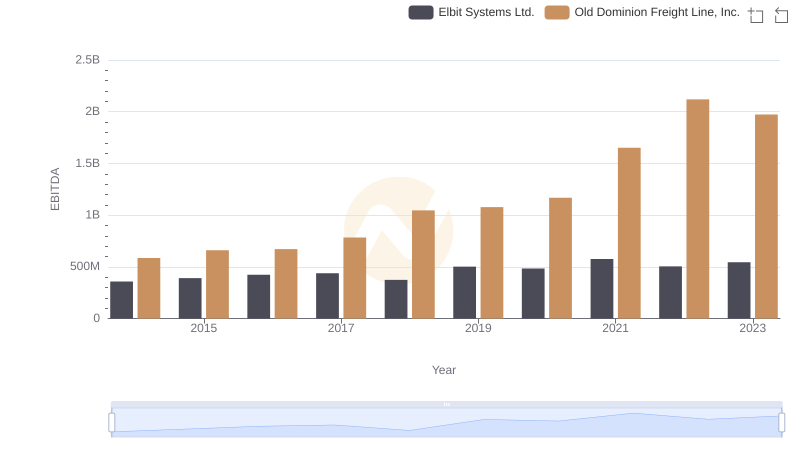
Comparative EBITDA Analysis: Old Dominion Freight Line, Inc. vs Elbit Systems Ltd.
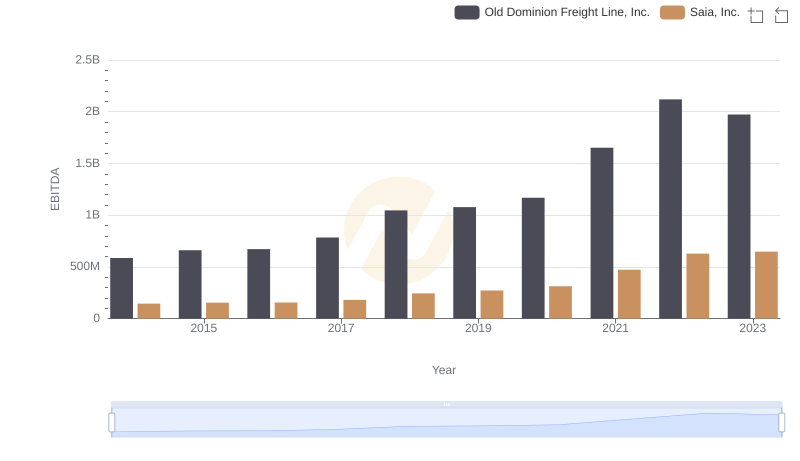
Comprehensive EBITDA Comparison: Old Dominion Freight Line, Inc. vs Saia, Inc.
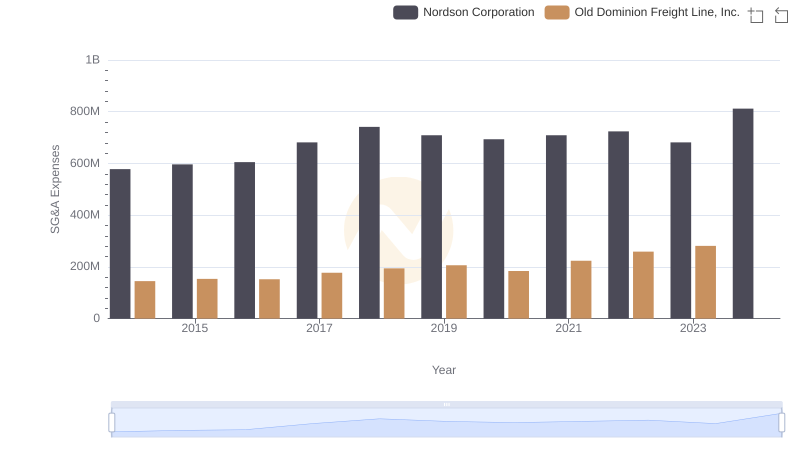
Breaking Down SG&A Expenses: Old Dominion Freight Line, Inc. vs Nordson Corporation
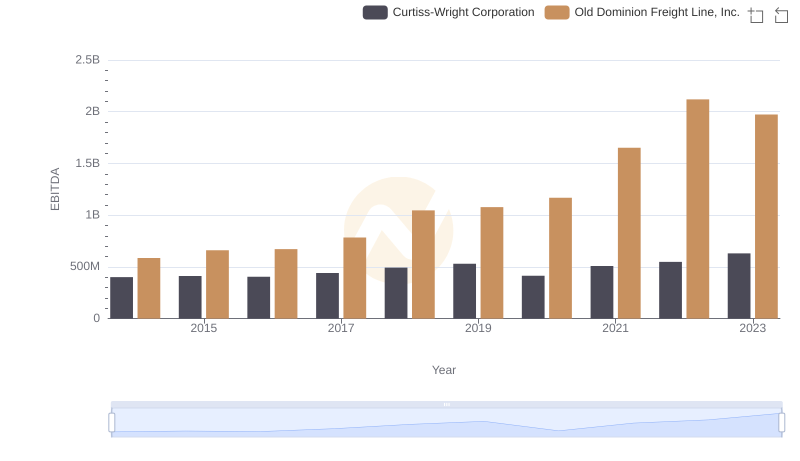
Professional EBITDA Benchmarking: Old Dominion Freight Line, Inc. vs Curtiss-Wright Corporation
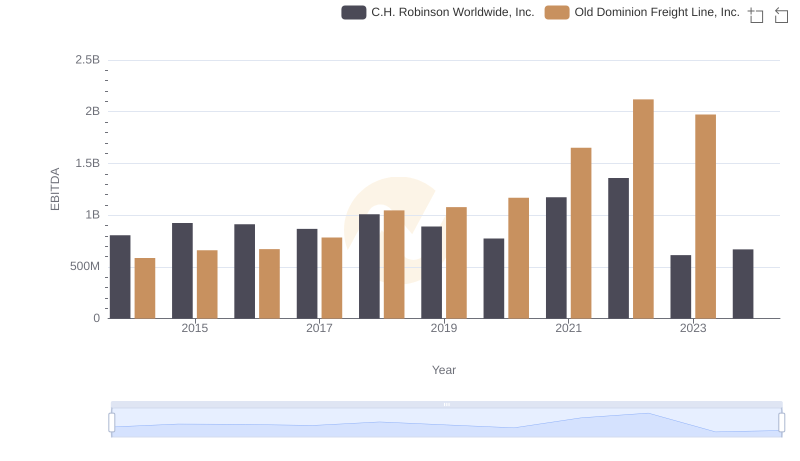
A Professional Review of EBITDA: Old Dominion Freight Line, Inc. Compared to C.H. Robinson Worldwide, Inc.
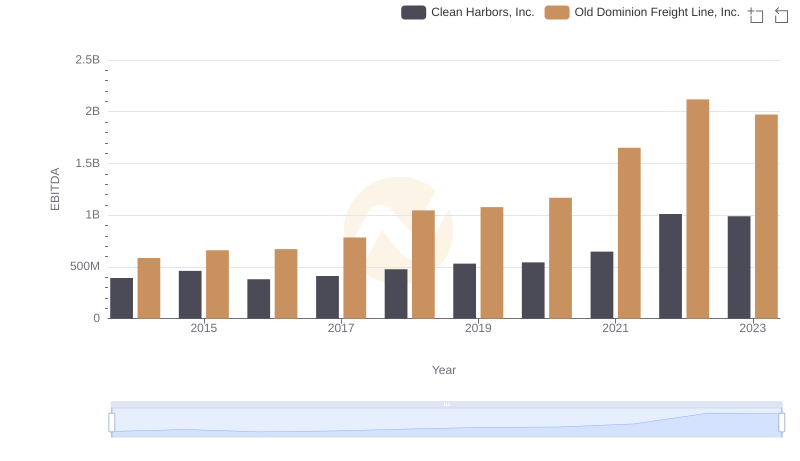
A Side-by-Side Analysis of EBITDA: Old Dominion Freight Line, Inc. and Clean Harbors, Inc.
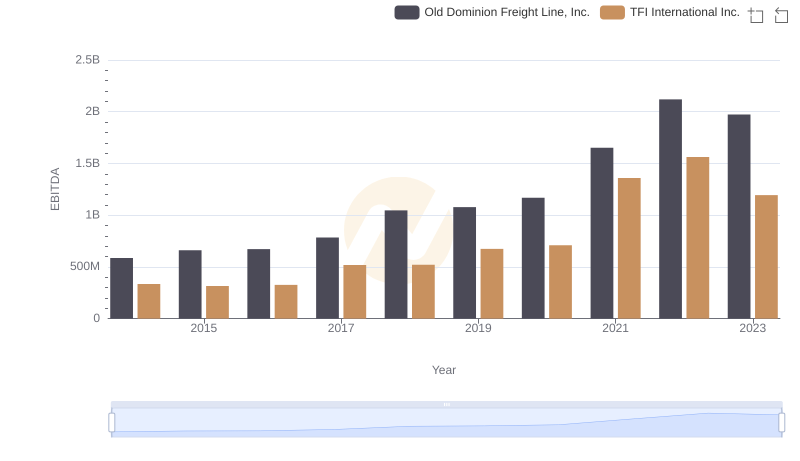
Old Dominion Freight Line, Inc. vs TFI International Inc.: In-Depth EBITDA Performance Comparison
EBITDA Metrics Evaluated: Old Dominion Freight Line, Inc. vs ITT Inc.