| __timestamp | Old Dominion Freight Line, Inc. | TFI International Inc. |
|---|---|---|
| Wednesday, January 1, 2014 | 2100409000 | 2782605137 |
| Thursday, January 1, 2015 | 2214943000 | 2551474032 |
| Friday, January 1, 2016 | 2246890000 | 2636493564 |
| Sunday, January 1, 2017 | 2482732000 | 3364979721 |
| Monday, January 1, 2018 | 2899452000 | 3251443800 |
| Tuesday, January 1, 2019 | 2938895000 | 3461987950 |
| Wednesday, January 1, 2020 | 2786531000 | 3239249000 |
| Friday, January 1, 2021 | 3481268000 | 6182566000 |
| Saturday, January 1, 2022 | 4003951000 | 7385640000 |
| Sunday, January 1, 2023 | 3793953000 | 6255775000 |
Unleashing insights
The freight industry has witnessed significant shifts over the past decade, with companies like Old Dominion Freight Line, Inc. and TFI International Inc. leading the charge. From 2014 to 2023, Old Dominion's cost of revenue increased by approximately 80%, peaking in 2022. Meanwhile, TFI International saw a staggering 165% rise, with a notable spike in 2022. This growth reflects the industry's adaptation to evolving market demands and economic conditions. Notably, 2021 marked a pivotal year for TFI International, with a 90% surge in cost of revenue, likely driven by strategic acquisitions and expansion efforts. As the industry continues to evolve, these trends offer valuable insights into the operational strategies of leading freight companies. Understanding these dynamics is crucial for stakeholders aiming to navigate the competitive landscape of the freight sector.
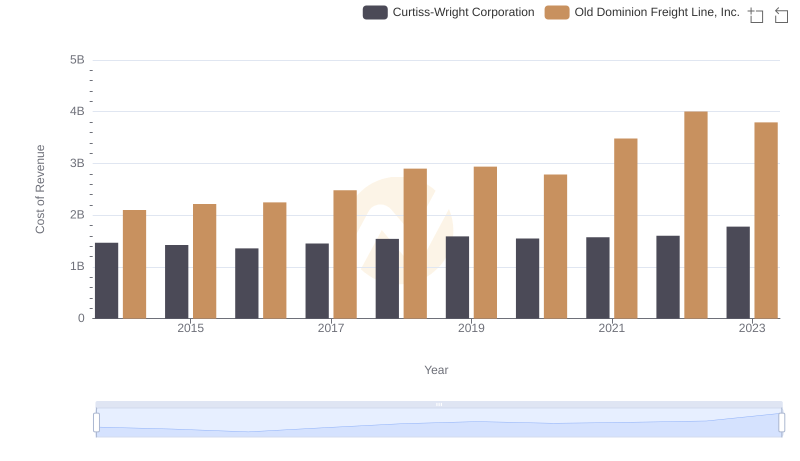
Cost of Revenue: Key Insights for Old Dominion Freight Line, Inc. and Curtiss-Wright Corporation
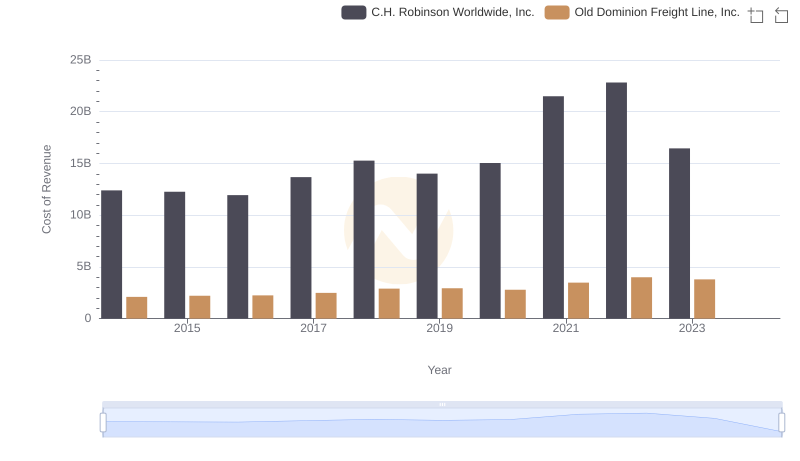
Comparing Cost of Revenue Efficiency: Old Dominion Freight Line, Inc. vs C.H. Robinson Worldwide, Inc.
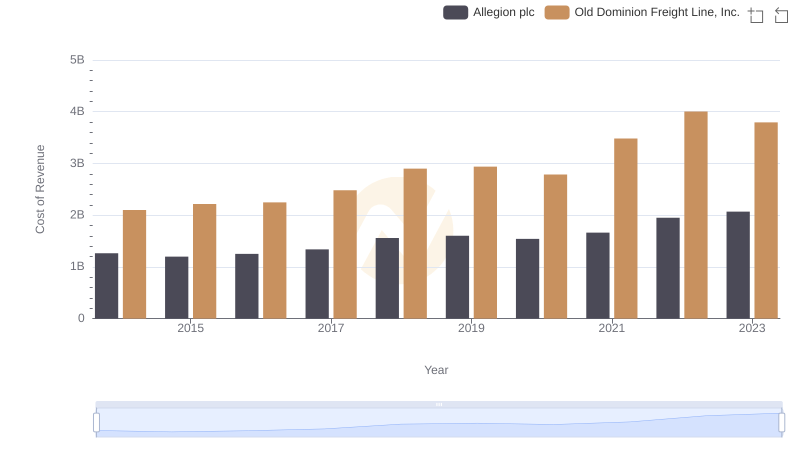
Comparing Cost of Revenue Efficiency: Old Dominion Freight Line, Inc. vs Allegion plc
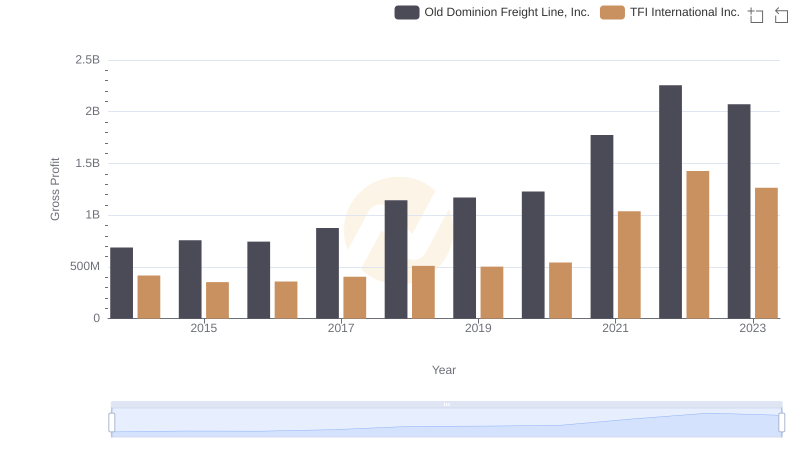
Gross Profit Analysis: Comparing Old Dominion Freight Line, Inc. and TFI International Inc.
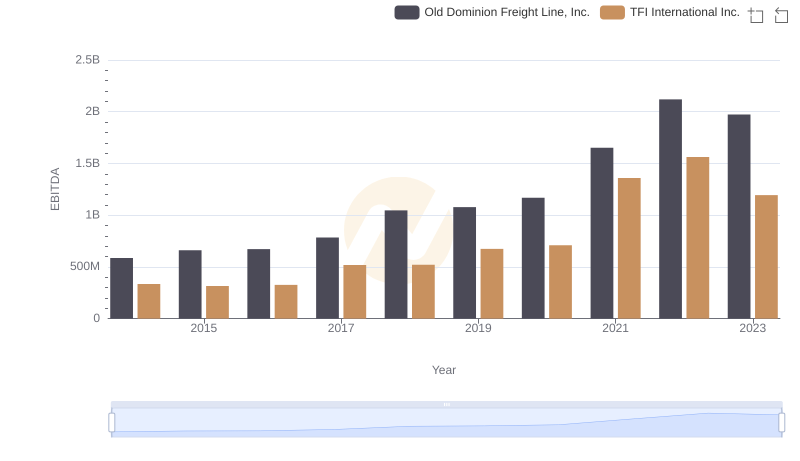
Old Dominion Freight Line, Inc. vs TFI International Inc.: In-Depth EBITDA Performance Comparison