| __timestamp | Old Dominion Freight Line, Inc. | TFI International Inc. |
|---|---|---|
| Wednesday, January 1, 2014 | 687488000 | 417323364 |
| Thursday, January 1, 2015 | 757499000 | 352552803 |
| Friday, January 1, 2016 | 744627000 | 358230042 |
| Sunday, January 1, 2017 | 875380000 | 405214314 |
| Monday, January 1, 2018 | 1144243000 | 510006388 |
| Tuesday, January 1, 2019 | 1170216000 | 502631921 |
| Wednesday, January 1, 2020 | 1228598000 | 541885000 |
| Friday, January 1, 2021 | 1775060000 | 1037863000 |
| Saturday, January 1, 2022 | 2256126000 | 1426851000 |
| Sunday, January 1, 2023 | 2072199000 | 1265392000 |
Unlocking the unknown
In the competitive landscape of the freight industry, Old Dominion Freight Line, Inc. and TFI International Inc. have shown remarkable growth over the past decade. From 2014 to 2023, Old Dominion's gross profit surged by approximately 202%, peaking in 2022. Meanwhile, TFI International experienced a robust 242% increase, with its highest gross profit recorded in the same year. This growth reflects the companies' strategic expansions and operational efficiencies.
These trends highlight the resilience and adaptability of these industry leaders in navigating economic challenges and capitalizing on market opportunities.
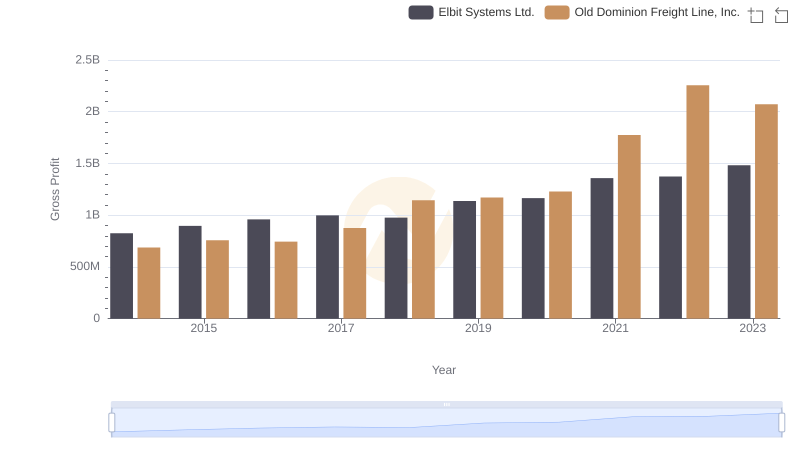
Gross Profit Trends Compared: Old Dominion Freight Line, Inc. vs Elbit Systems Ltd.
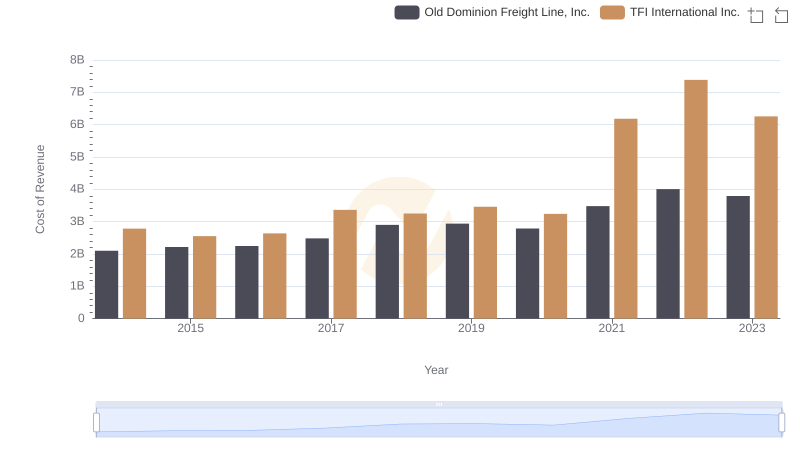
Cost of Revenue: Key Insights for Old Dominion Freight Line, Inc. and TFI International Inc.
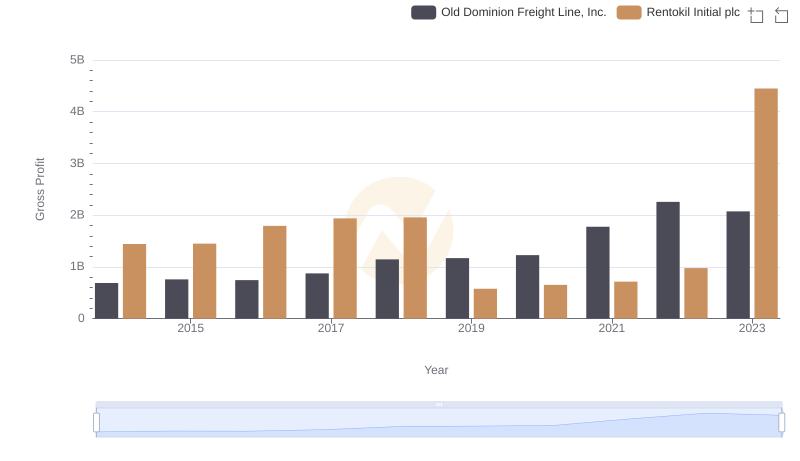
Gross Profit Comparison: Old Dominion Freight Line, Inc. and Rentokil Initial plc Trends
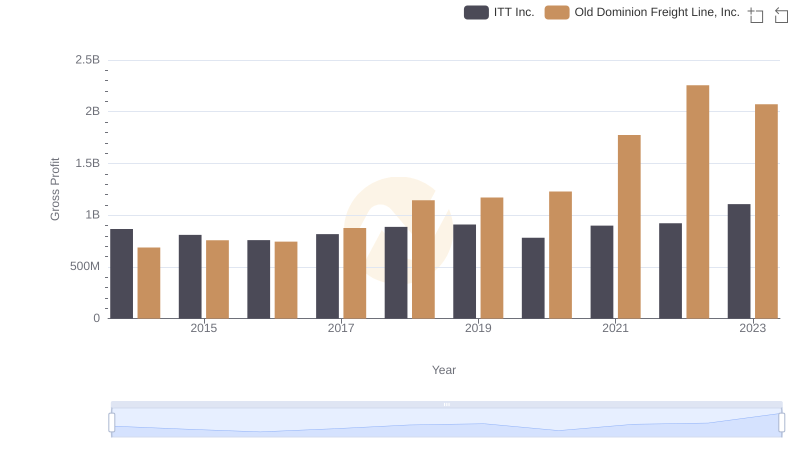
Gross Profit Comparison: Old Dominion Freight Line, Inc. and ITT Inc. Trends
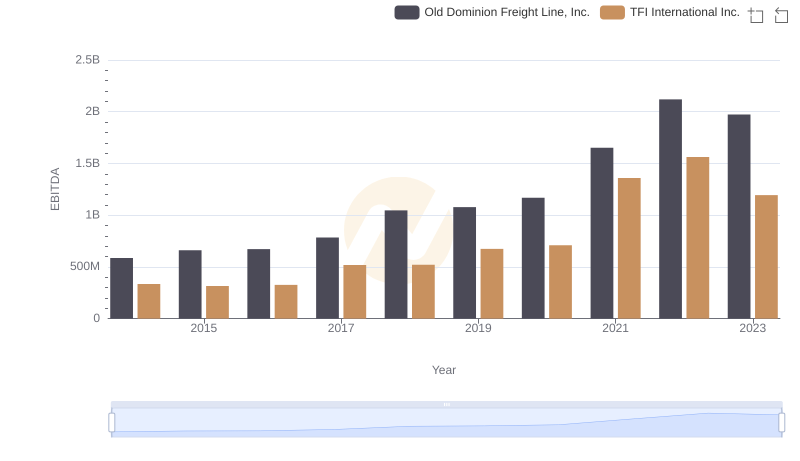
Old Dominion Freight Line, Inc. vs TFI International Inc.: In-Depth EBITDA Performance Comparison