| __timestamp | C.H. Robinson Worldwide, Inc. | Old Dominion Freight Line, Inc. |
|---|---|---|
| Wednesday, January 1, 2014 | 805427000 | 585590000 |
| Thursday, January 1, 2015 | 924719000 | 660570000 |
| Friday, January 1, 2016 | 912200000 | 671786000 |
| Sunday, January 1, 2017 | 868096000 | 783749000 |
| Monday, January 1, 2018 | 1008812000 | 1046059000 |
| Tuesday, January 1, 2019 | 890425000 | 1078007000 |
| Wednesday, January 1, 2020 | 774995000 | 1168149000 |
| Friday, January 1, 2021 | 1173367000 | 1651501000 |
| Saturday, January 1, 2022 | 1359558000 | 2118962000 |
| Sunday, January 1, 2023 | 613592000 | 1972689000 |
| Monday, January 1, 2024 | 766301000 |
Unleashing the power of data
In the ever-evolving landscape of logistics and freight, understanding financial health is crucial. This analysis delves into the EBITDA trends of two industry giants: Old Dominion Freight Line, Inc. and C.H. Robinson Worldwide, Inc., from 2014 to 2023. Over this period, Old Dominion has shown a remarkable growth trajectory, with its EBITDA increasing by approximately 237%, peaking in 2022. In contrast, C.H. Robinson experienced a more modest growth of around 69% during the same period, with a notable dip in 2023. This divergence highlights Old Dominion's robust operational efficiency and market adaptability. The data also reveals missing values for Old Dominion in 2024, suggesting potential reporting delays or strategic shifts. As the logistics sector continues to adapt to global challenges, these insights provide a window into the financial strategies of leading players.
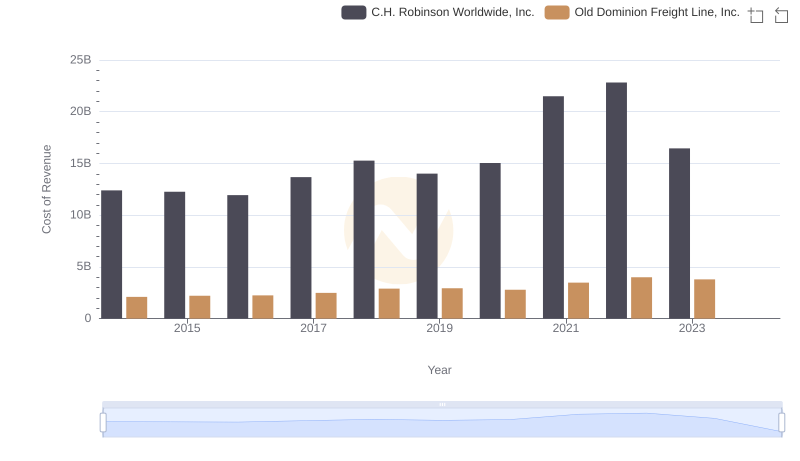
Comparing Cost of Revenue Efficiency: Old Dominion Freight Line, Inc. vs C.H. Robinson Worldwide, Inc.
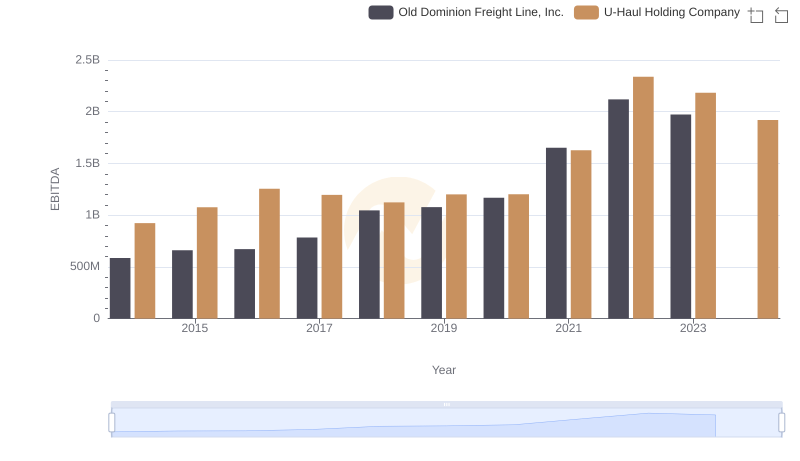
A Side-by-Side Analysis of EBITDA: Old Dominion Freight Line, Inc. and U-Haul Holding Company
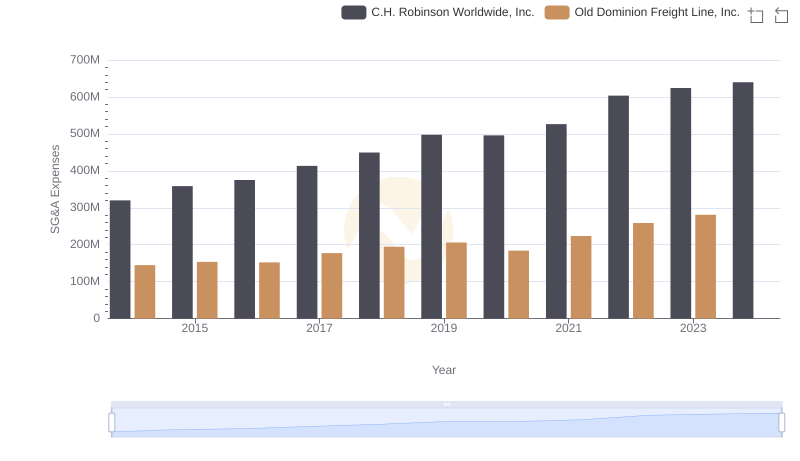
Comparing SG&A Expenses: Old Dominion Freight Line, Inc. vs C.H. Robinson Worldwide, Inc. Trends and Insights
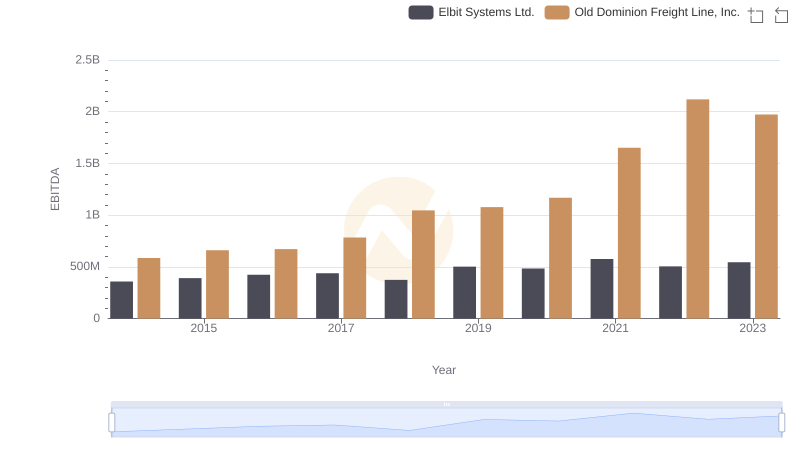
Comparative EBITDA Analysis: Old Dominion Freight Line, Inc. vs Elbit Systems Ltd.
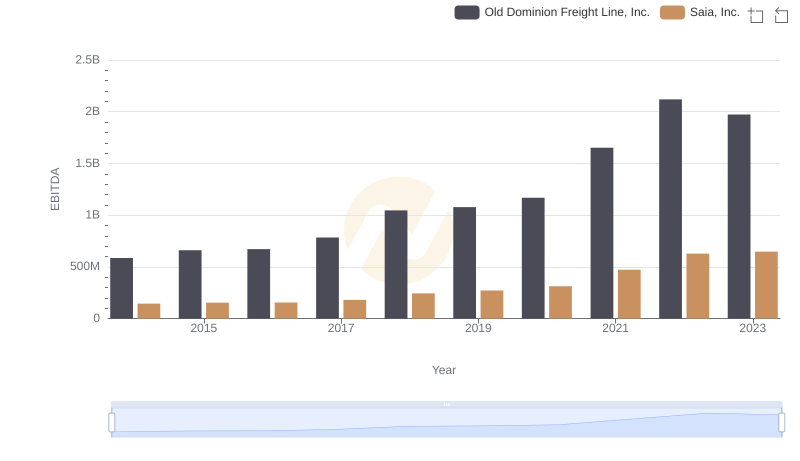
Comprehensive EBITDA Comparison: Old Dominion Freight Line, Inc. vs Saia, Inc.
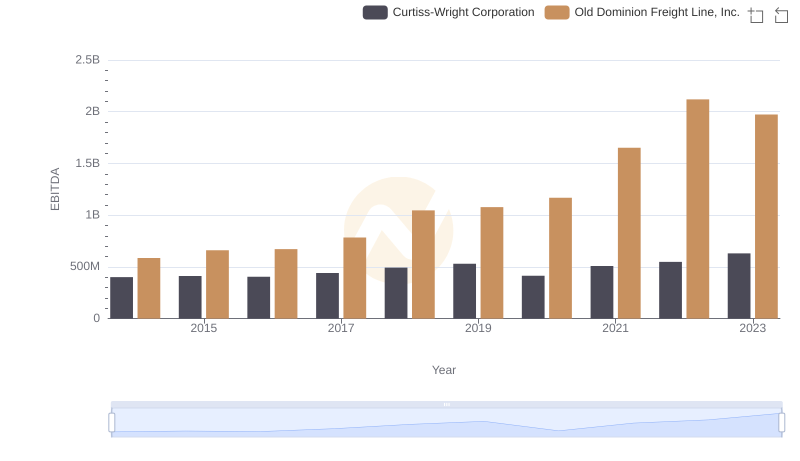
Professional EBITDA Benchmarking: Old Dominion Freight Line, Inc. vs Curtiss-Wright Corporation
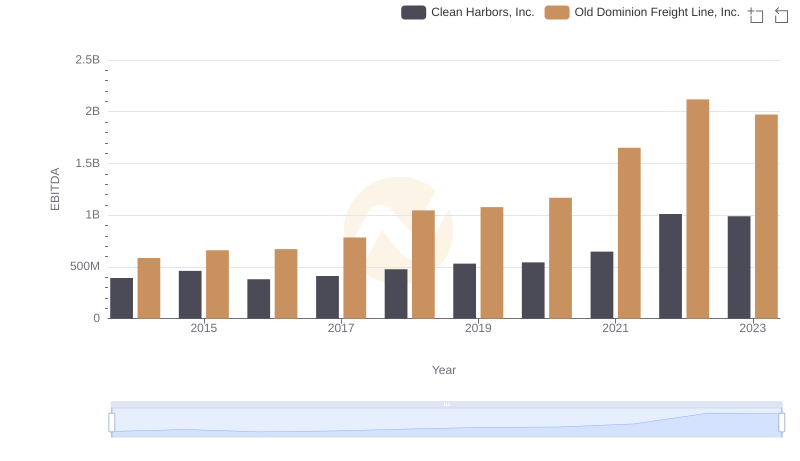
A Side-by-Side Analysis of EBITDA: Old Dominion Freight Line, Inc. and Clean Harbors, Inc.
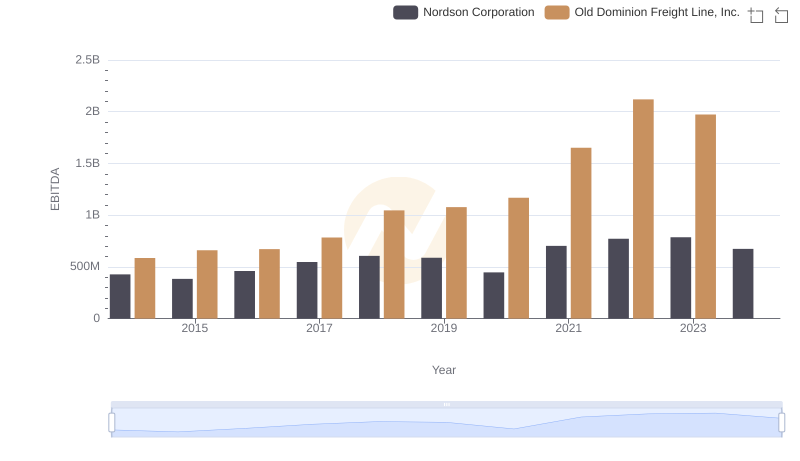
Comprehensive EBITDA Comparison: Old Dominion Freight Line, Inc. vs Nordson Corporation
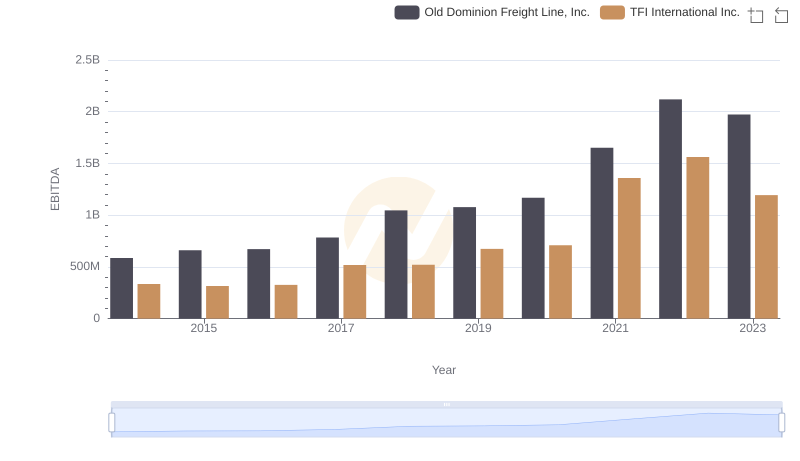
Old Dominion Freight Line, Inc. vs TFI International Inc.: In-Depth EBITDA Performance Comparison