| __timestamp | Allegion plc | Old Dominion Freight Line, Inc. |
|---|---|---|
| Wednesday, January 1, 2014 | 365700000 | 585590000 |
| Thursday, January 1, 2015 | 315400000 | 660570000 |
| Friday, January 1, 2016 | 422600000 | 671786000 |
| Sunday, January 1, 2017 | 523300000 | 783749000 |
| Monday, January 1, 2018 | 617600000 | 1046059000 |
| Tuesday, January 1, 2019 | 614300000 | 1078007000 |
| Wednesday, January 1, 2020 | 497700000 | 1168149000 |
| Friday, January 1, 2021 | 657300000 | 1651501000 |
| Saturday, January 1, 2022 | 688300000 | 2118962000 |
| Sunday, January 1, 2023 | 819300000 | 1972689000 |
| Monday, January 1, 2024 | 919800000 |
Unleashing insights
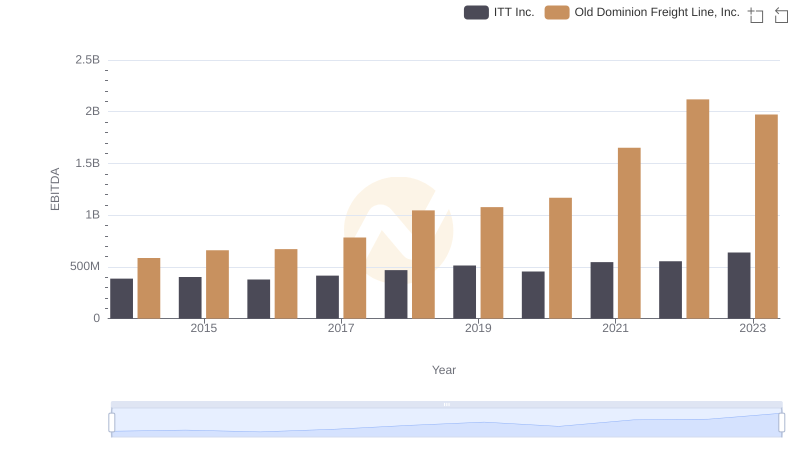
In the ever-evolving landscape of logistics and security solutions, Old Dominion Freight Line, Inc. and Allegion plc have demonstrated remarkable financial trajectories over the past decade. From 2014 to 2023, Old Dominion Freight Line's EBITDA surged by an impressive 237%, reflecting its robust growth in the freight industry. Meanwhile, Allegion plc, a leader in security products, saw its EBITDA increase by 124%, showcasing its resilience and adaptability in a competitive market.
Old Dominion consistently outperformed Allegion, with its EBITDA peaking at nearly 2.12 billion in 2022, compared to Allegion's 819 million in 2023. This side-by-side analysis highlights the dynamic shifts in these industries, offering valuable insights for investors and industry enthusiasts alike. As we look to the future, these trends underscore the importance of strategic growth and innovation in maintaining a competitive edge.
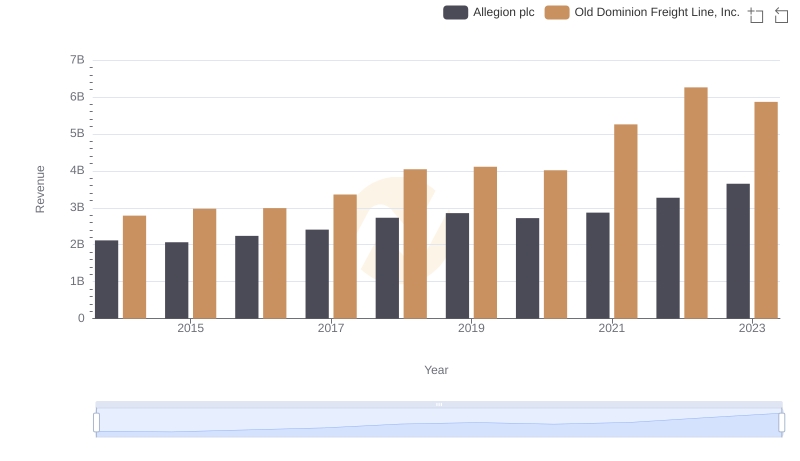
Revenue Insights: Old Dominion Freight Line, Inc. and Allegion plc Performance Compared
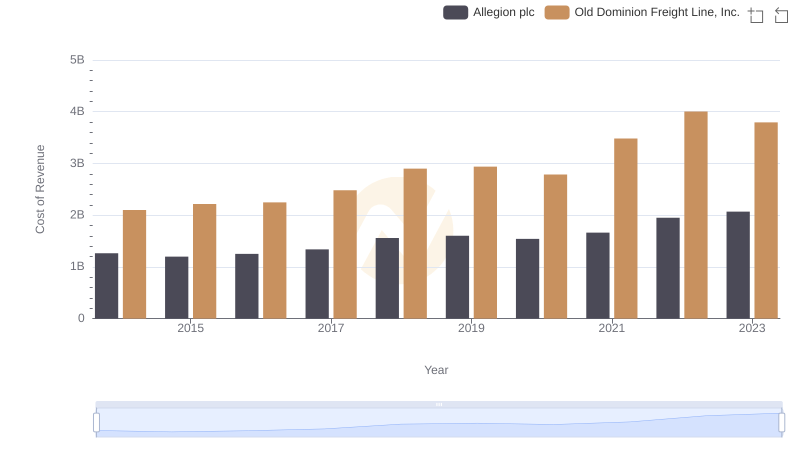
Comparing Cost of Revenue Efficiency: Old Dominion Freight Line, Inc. vs Allegion plc
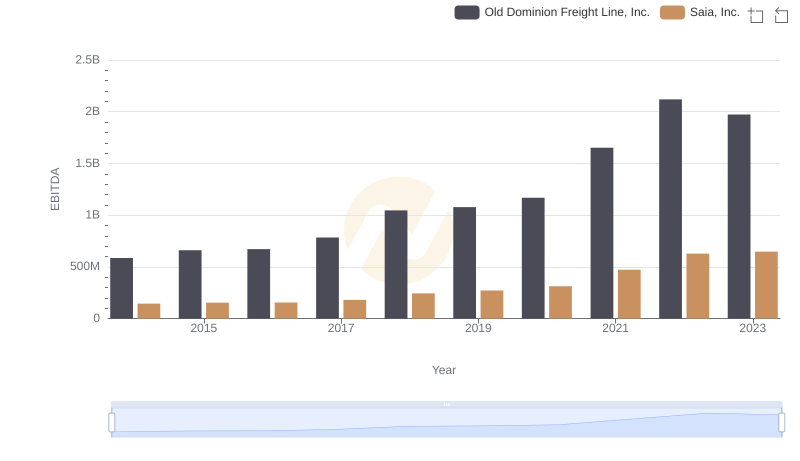
Comprehensive EBITDA Comparison: Old Dominion Freight Line, Inc. vs Saia, Inc.
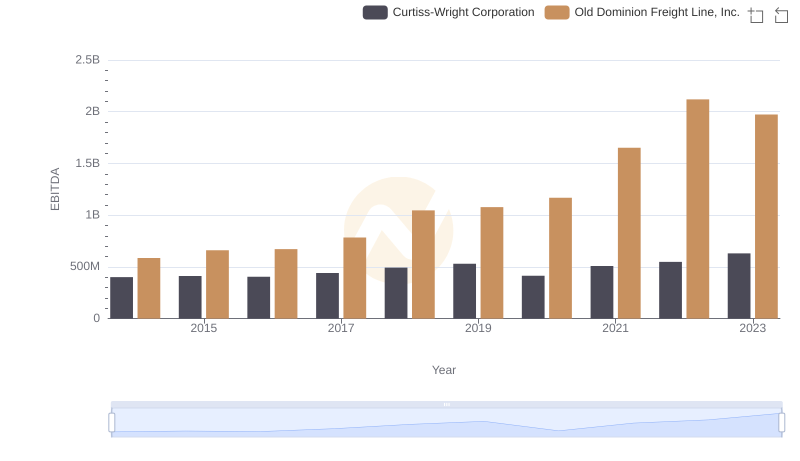
Professional EBITDA Benchmarking: Old Dominion Freight Line, Inc. vs Curtiss-Wright Corporation
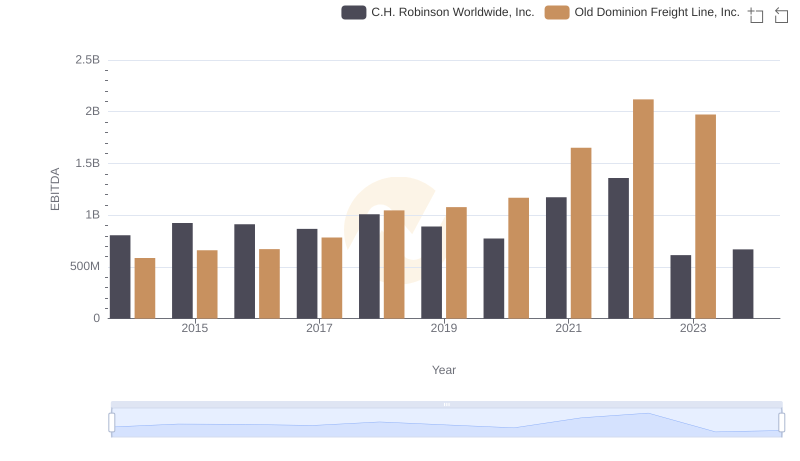
A Professional Review of EBITDA: Old Dominion Freight Line, Inc. Compared to C.H. Robinson Worldwide, Inc.
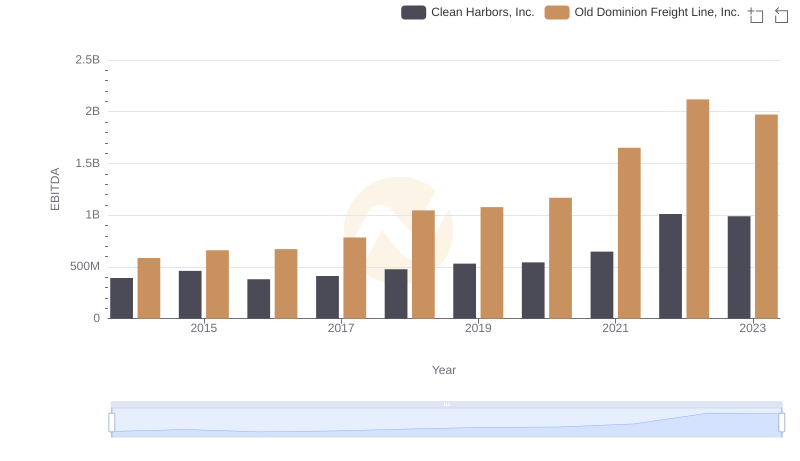
A Side-by-Side Analysis of EBITDA: Old Dominion Freight Line, Inc. and Clean Harbors, Inc.
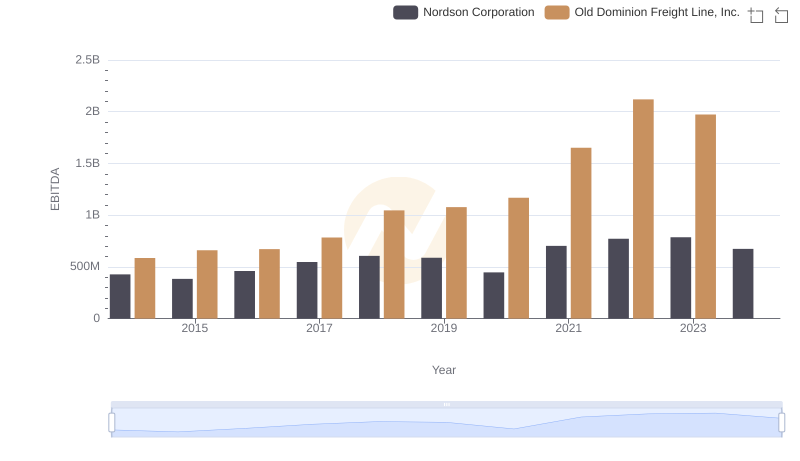
Comprehensive EBITDA Comparison: Old Dominion Freight Line, Inc. vs Nordson Corporation
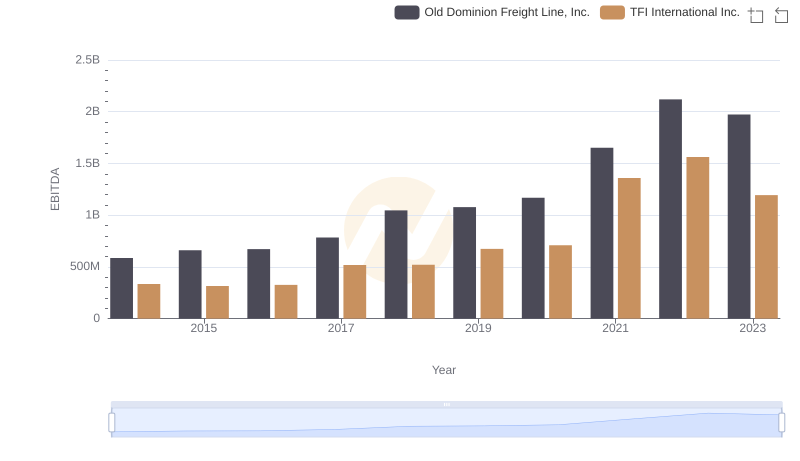
Old Dominion Freight Line, Inc. vs TFI International Inc.: In-Depth EBITDA Performance Comparison
EBITDA Metrics Evaluated: Old Dominion Freight Line, Inc. vs ITT Inc.