| __timestamp | Trane Technologies plc | XPO Logistics, Inc. |
|---|---|---|
| Wednesday, January 1, 2014 | 8982800000 | 1975000000 |
| Thursday, January 1, 2015 | 9301600000 | 6538400000 |
| Friday, January 1, 2016 | 9329300000 | 12480100000 |
| Sunday, January 1, 2017 | 9811600000 | 13101100000 |
| Monday, January 1, 2018 | 10847600000 | 14738000000 |
| Tuesday, January 1, 2019 | 11451500000 | 13982000000 |
| Wednesday, January 1, 2020 | 8651300000 | 13689000000 |
| Friday, January 1, 2021 | 9666800000 | 10812000000 |
| Saturday, January 1, 2022 | 11026900000 | 6491000000 |
| Sunday, January 1, 2023 | 11820400000 | 6974000000 |
| Monday, January 1, 2024 | 12757700000 | 7157000000 |
Igniting the spark of knowledge
In the ever-evolving landscape of logistics and technology, Trane Technologies plc and XPO Logistics, Inc. have showcased intriguing cost of revenue trends over the past decade. From 2014 to 2023, Trane Technologies saw a steady increase in its cost of revenue, peaking in 2023 with a 32% rise from its 2014 figures. Meanwhile, XPO Logistics experienced a more volatile journey, with a dramatic 645% surge from 2014 to 2018, followed by a notable decline in recent years.
These trends highlight the dynamic nature of cost management in the logistics and technology sectors, offering valuable insights for investors and industry analysts alike.
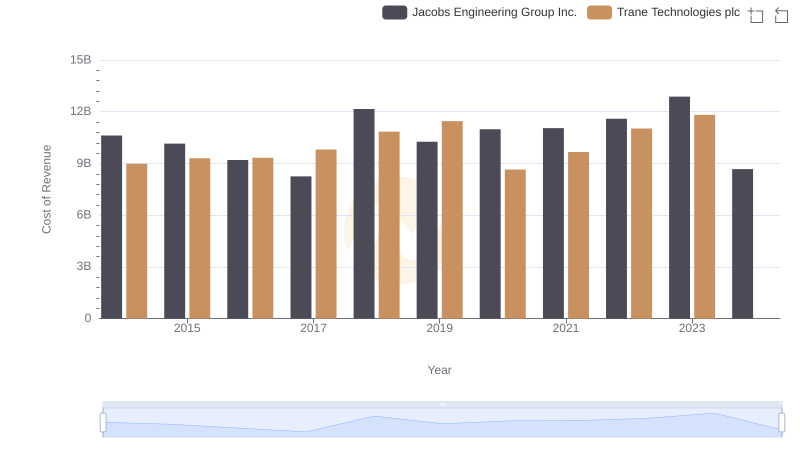
Comparing Cost of Revenue Efficiency: Trane Technologies plc vs Jacobs Engineering Group Inc.
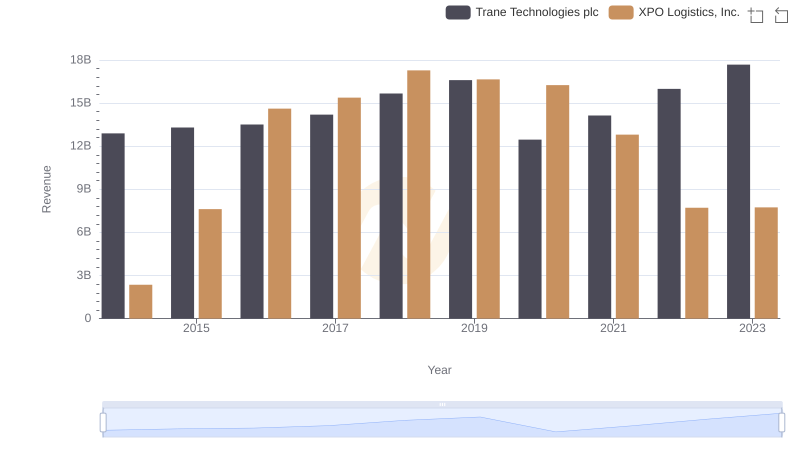
Trane Technologies plc or XPO Logistics, Inc.: Who Leads in Yearly Revenue?
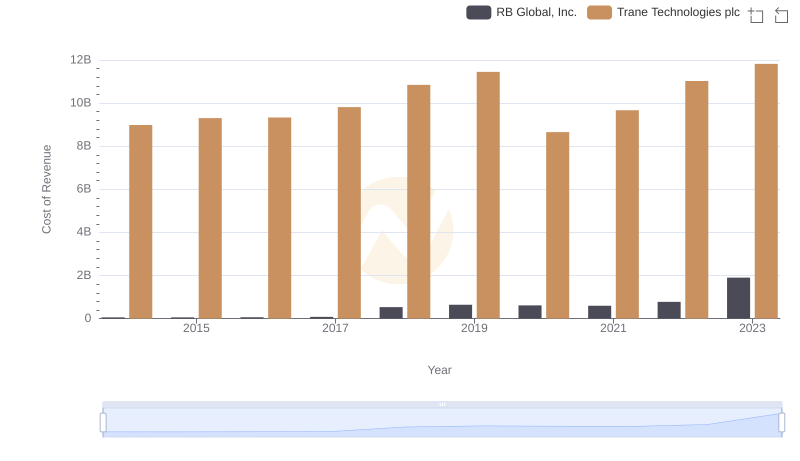
Cost Insights: Breaking Down Trane Technologies plc and RB Global, Inc.'s Expenses

Comparing Cost of Revenue Efficiency: Trane Technologies plc vs IDEX Corporation
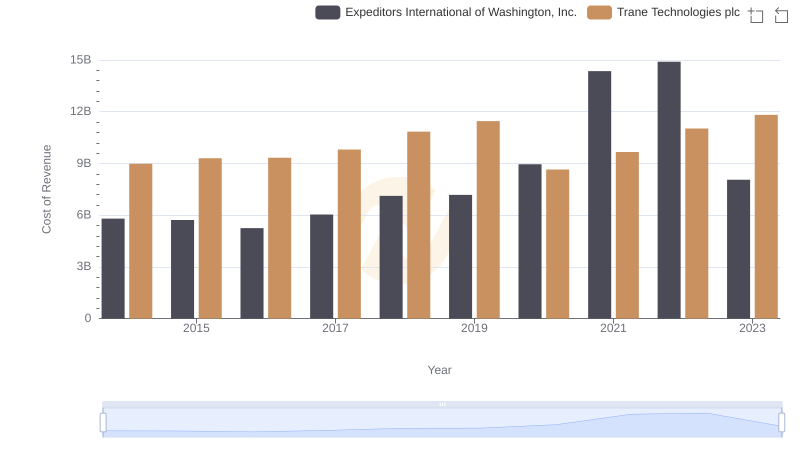
Analyzing Cost of Revenue: Trane Technologies plc and Expeditors International of Washington, Inc.
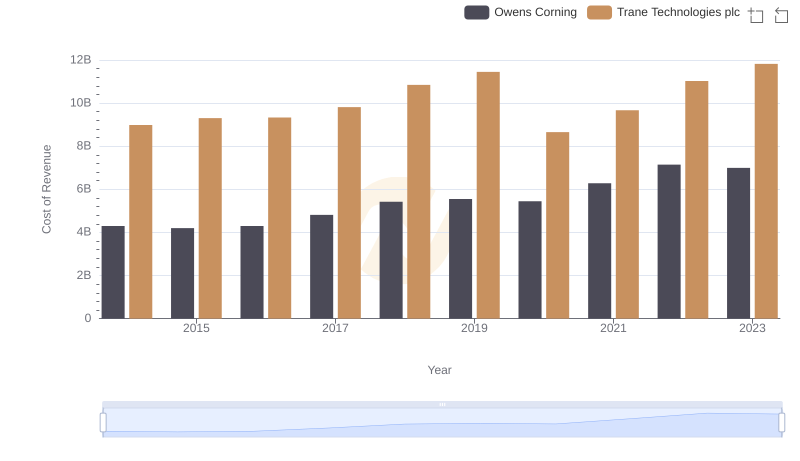
Cost Insights: Breaking Down Trane Technologies plc and Owens Corning's Expenses
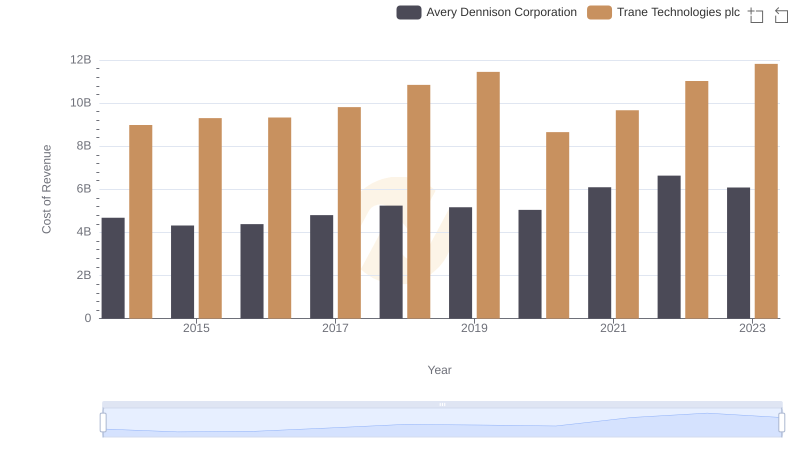
Comparing Cost of Revenue Efficiency: Trane Technologies plc vs Avery Dennison Corporation
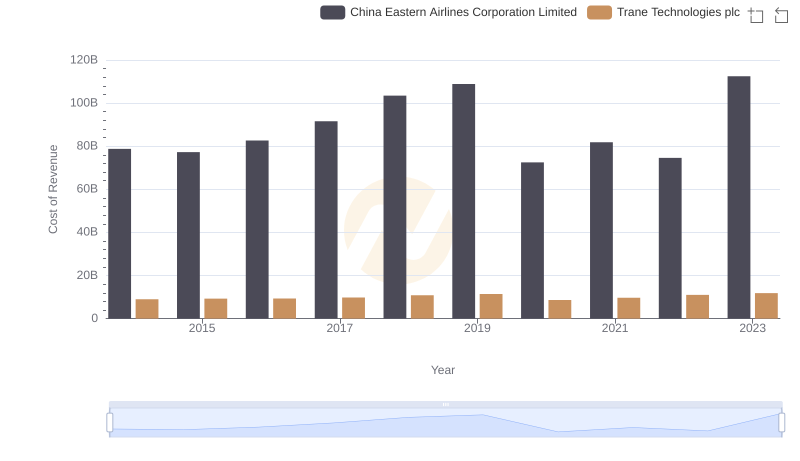
Cost Insights: Breaking Down Trane Technologies plc and China Eastern Airlines Corporation Limited's Expenses
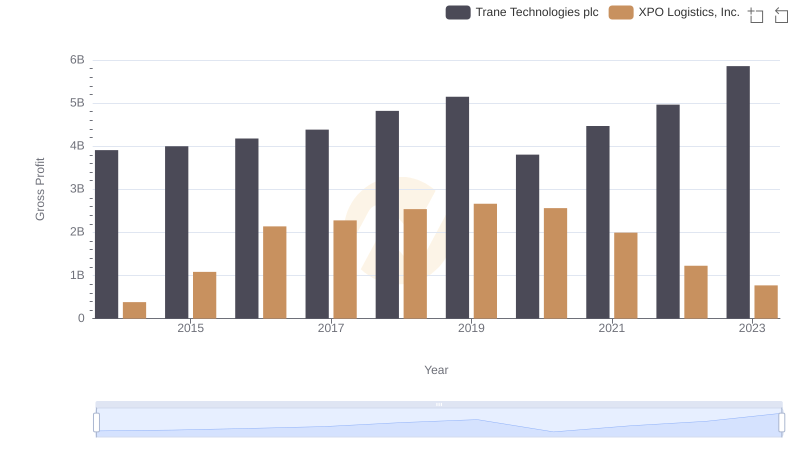
Key Insights on Gross Profit: Trane Technologies plc vs XPO Logistics, Inc.
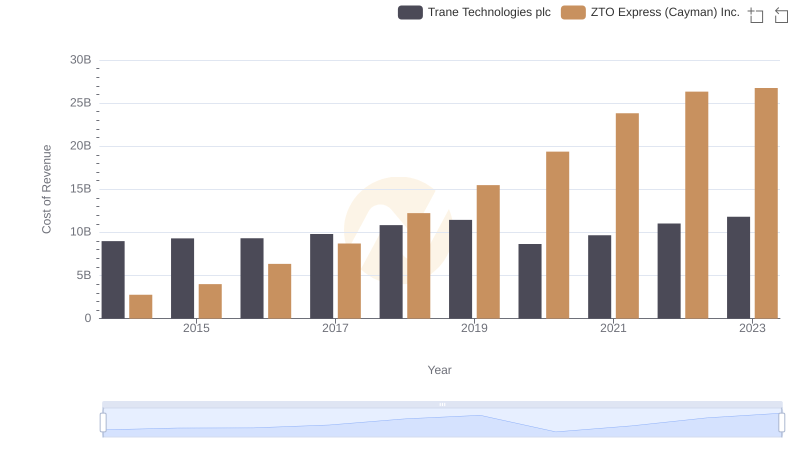
Cost Insights: Breaking Down Trane Technologies plc and ZTO Express (Cayman) Inc.'s Expenses
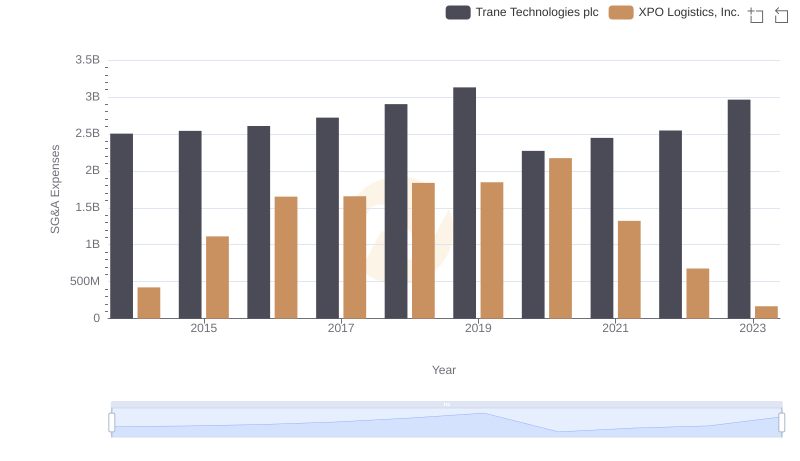
Cost Management Insights: SG&A Expenses for Trane Technologies plc and XPO Logistics, Inc.
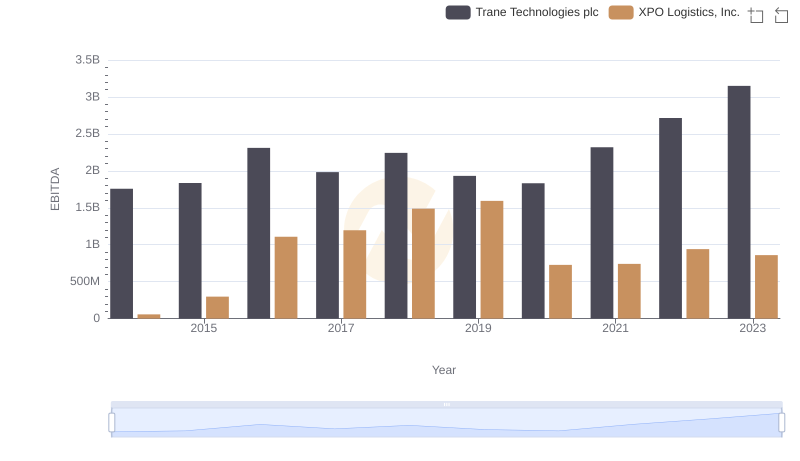
A Professional Review of EBITDA: Trane Technologies plc Compared to XPO Logistics, Inc.