| __timestamp | EMCOR Group, Inc. | Snap-on Incorporated |
|---|---|---|
| Wednesday, January 1, 2014 | 907246000 | 1584300000 |
| Thursday, January 1, 2015 | 944479000 | 1648300000 |
| Friday, January 1, 2016 | 1037862000 | 1709600000 |
| Sunday, January 1, 2017 | 1147012000 | 1824900000 |
| Monday, January 1, 2018 | 1205453000 | 1870000000 |
| Tuesday, January 1, 2019 | 1355868000 | 1844000000 |
| Wednesday, January 1, 2020 | 1395382000 | 1748500000 |
| Friday, January 1, 2021 | 1501737000 | 2110800000 |
| Saturday, January 1, 2022 | 1603594000 | 2181100000 |
| Sunday, January 1, 2023 | 2089339000 | 2619800000 |
| Monday, January 1, 2024 | 2377900000 |
Data in motion
In the ever-evolving landscape of American industry, EMCOR Group, Inc. and Snap-on Incorporated have emerged as stalwarts of financial resilience. From 2014 to 2023, these companies have demonstrated remarkable growth in gross profit, reflecting their strategic prowess and market adaptability.
EMCOR Group, Inc. has seen its gross profit soar by approximately 130% over the past decade, starting from 2014. Meanwhile, Snap-on Incorporated has experienced a robust 65% increase in the same period. By 2023, Snap-on's gross profit reached a peak, surpassing EMCOR by about 25%.
This upward trajectory highlights the companies' ability to navigate economic challenges and capitalize on market opportunities. As we look to the future, these trends suggest a promising outlook for both EMCOR and Snap-on, underscoring their roles as key players in their respective industries.
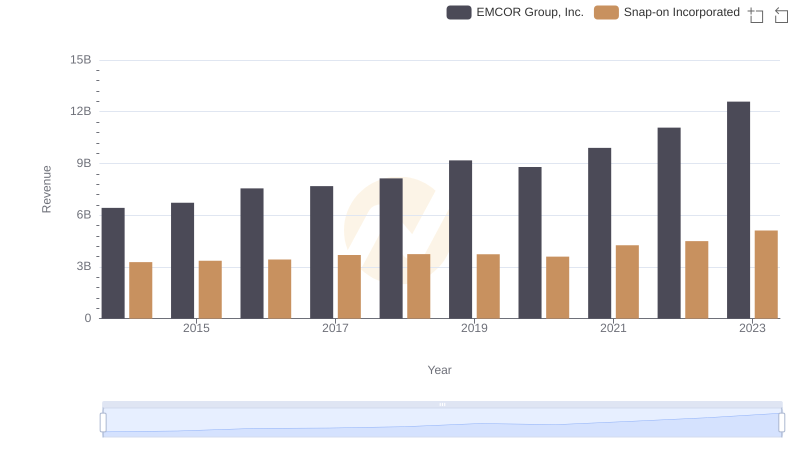
Annual Revenue Comparison: EMCOR Group, Inc. vs Snap-on Incorporated
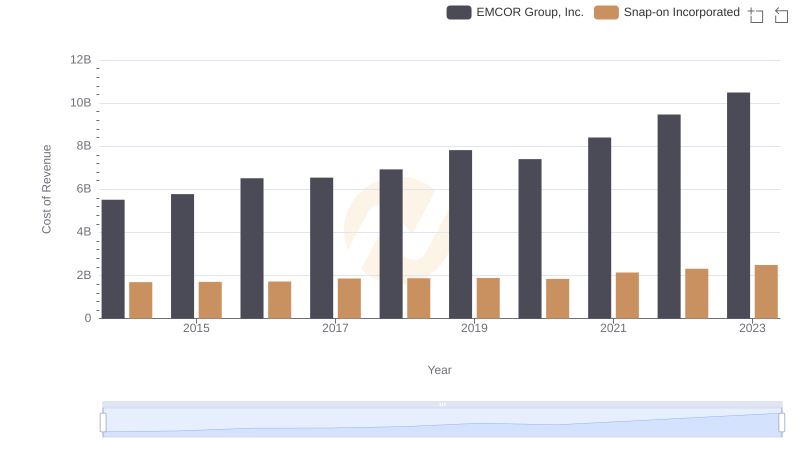
Cost of Revenue Comparison: EMCOR Group, Inc. vs Snap-on Incorporated
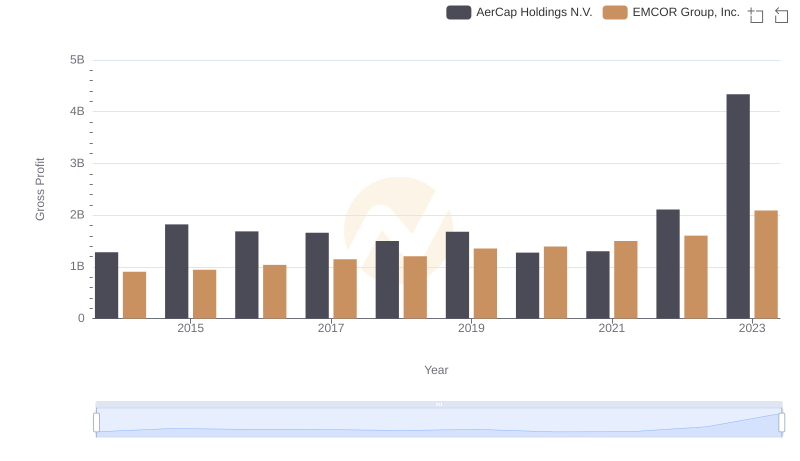
EMCOR Group, Inc. vs AerCap Holdings N.V.: A Gross Profit Performance Breakdown
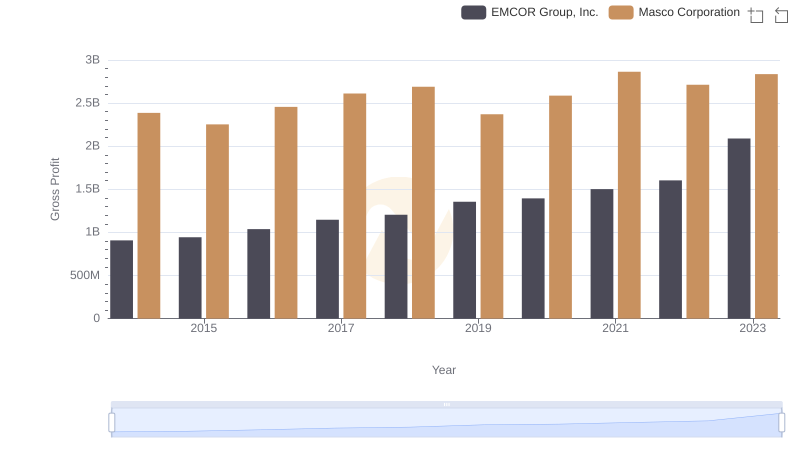
Gross Profit Trends Compared: EMCOR Group, Inc. vs Masco Corporation
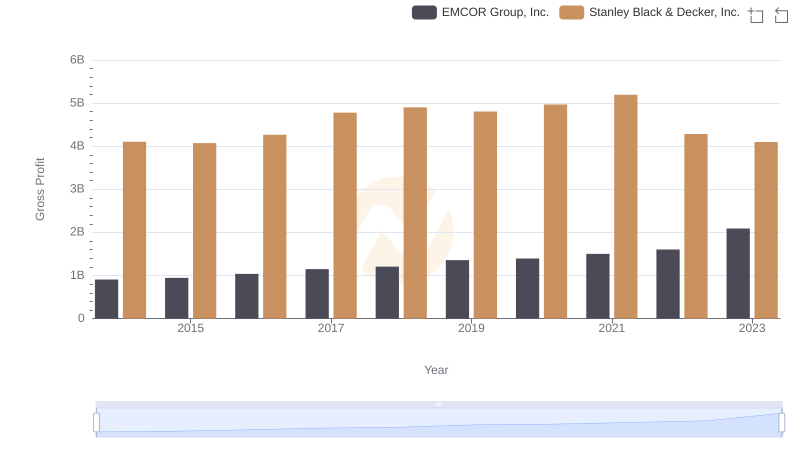
Key Insights on Gross Profit: EMCOR Group, Inc. vs Stanley Black & Decker, Inc.
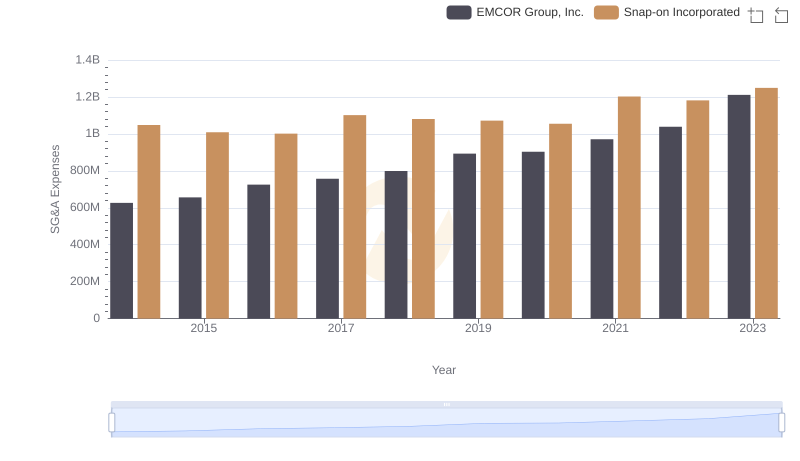
Breaking Down SG&A Expenses: EMCOR Group, Inc. vs Snap-on Incorporated
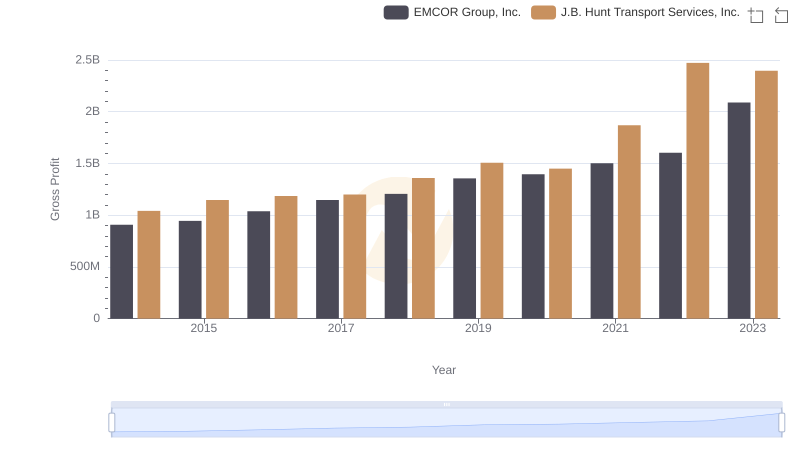
Gross Profit Trends Compared: EMCOR Group, Inc. vs J.B. Hunt Transport Services, Inc.
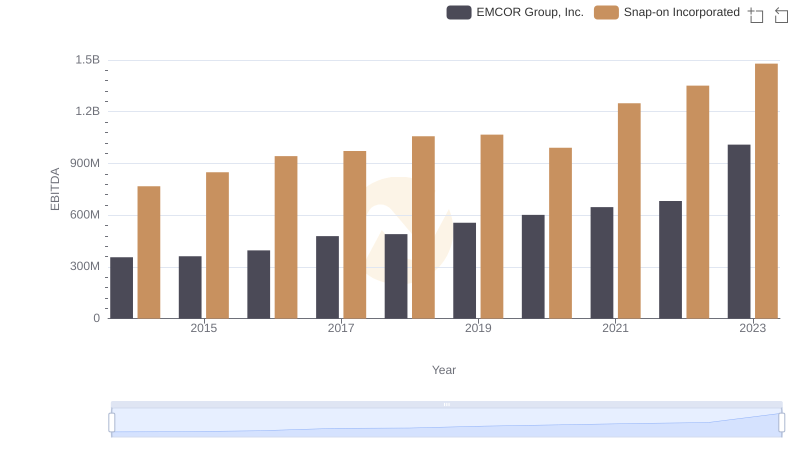
A Professional Review of EBITDA: EMCOR Group, Inc. Compared to Snap-on Incorporated
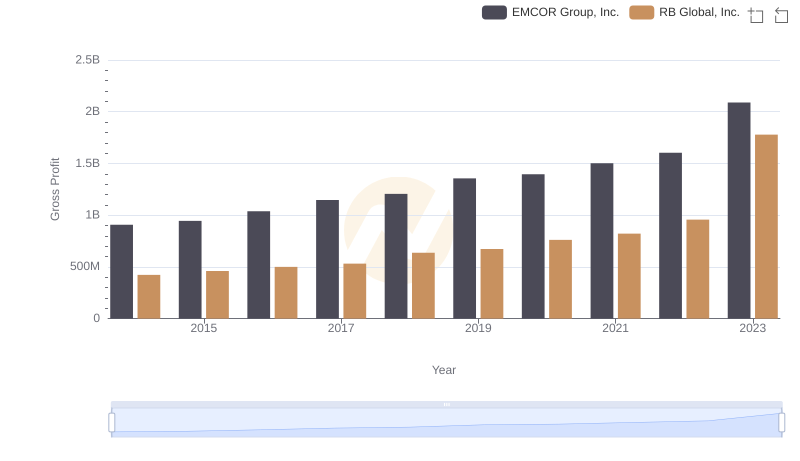
EMCOR Group, Inc. and RB Global, Inc.: A Detailed Gross Profit Analysis