| __timestamp | Intuit Inc. | Teledyne Technologies Incorporated |
|---|---|---|
| Wednesday, January 1, 2014 | 1762000000 | 612400000 |
| Thursday, January 1, 2015 | 1771000000 | 588600000 |
| Friday, January 1, 2016 | 1807000000 | 574100000 |
| Sunday, January 1, 2017 | 1973000000 | 656000000 |
| Monday, January 1, 2018 | 2298000000 | 694200000 |
| Tuesday, January 1, 2019 | 2524000000 | 751600000 |
| Wednesday, January 1, 2020 | 2727000000 | 700800000 |
| Friday, January 1, 2021 | 3626000000 | 1067800000 |
| Saturday, January 1, 2022 | 4986000000 | 1156600000 |
| Sunday, January 1, 2023 | 5062000000 | 1208300000 |
| Monday, January 1, 2024 | 5730000000 |
Infusing magic into the data realm
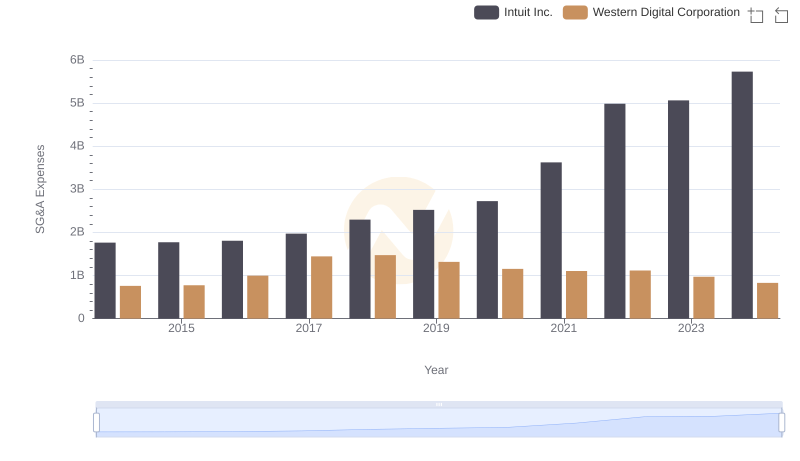
In the ever-evolving landscape of corporate finance, understanding the nuances of Selling, General, and Administrative (SG&A) expenses is crucial. Over the past decade, Intuit Inc. has seen a remarkable 225% increase in its SG&A expenses, reflecting its aggressive growth strategy and market expansion. In contrast, Teledyne Technologies Incorporated has maintained a more conservative trajectory, with a 97% rise in the same period.
From 2014 to 2023, Intuit's SG&A expenses surged from approximately $1.8 billion to over $5 billion, highlighting its commitment to innovation and customer acquisition. Meanwhile, Teledyne's expenses grew from around $612 million to $1.2 billion, indicating steady growth. Notably, data for 2024 is incomplete for Teledyne, suggesting potential shifts in strategy. This analysis underscores the diverse approaches these companies take in managing operational costs, offering valuable insights for investors and industry analysts alike.
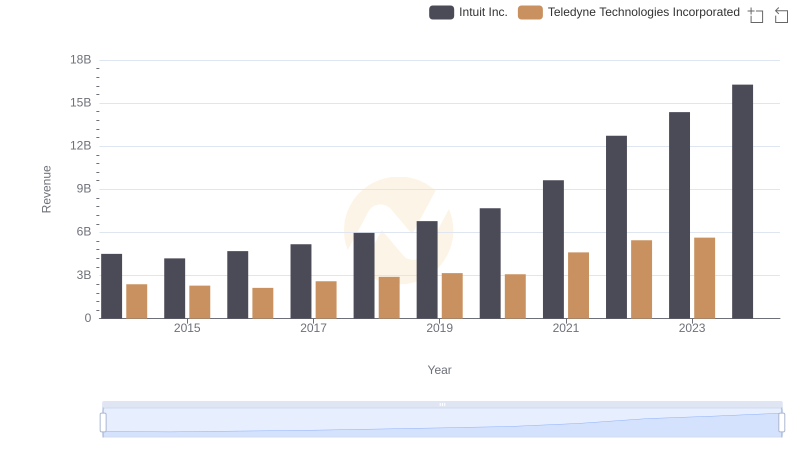
Annual Revenue Comparison: Intuit Inc. vs Teledyne Technologies Incorporated
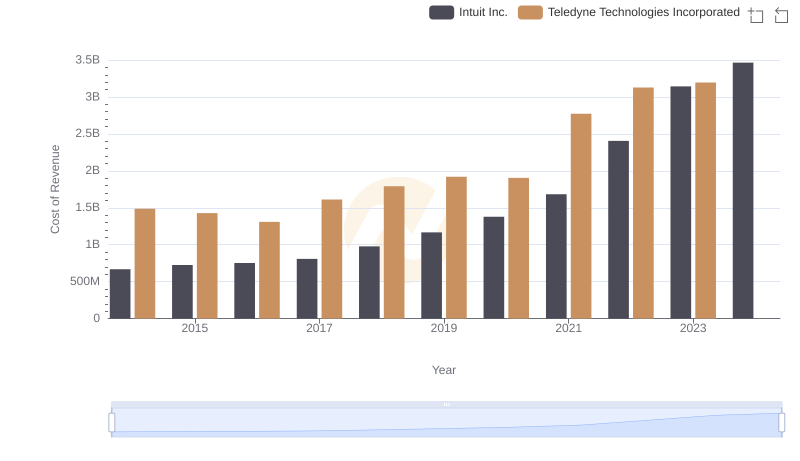
Intuit Inc. vs Teledyne Technologies Incorporated: Efficiency in Cost of Revenue Explored
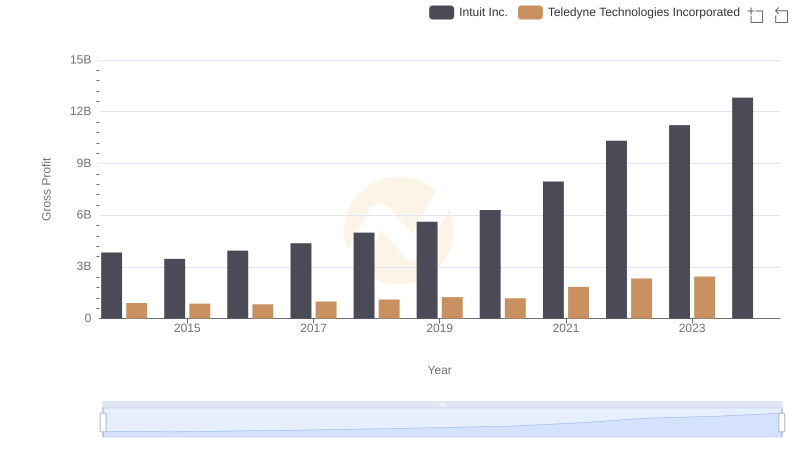
Intuit Inc. vs Teledyne Technologies Incorporated: A Gross Profit Performance Breakdown

Analyzing R&D Budgets: Intuit Inc. vs Teledyne Technologies Incorporated
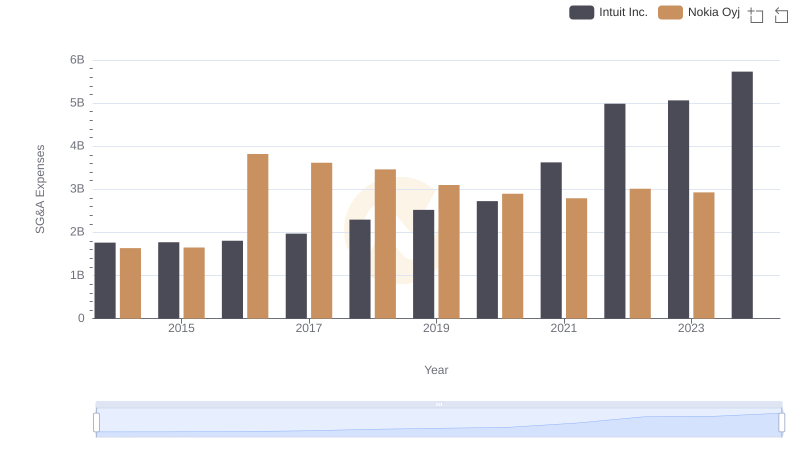
SG&A Efficiency Analysis: Comparing Intuit Inc. and Nokia Oyj
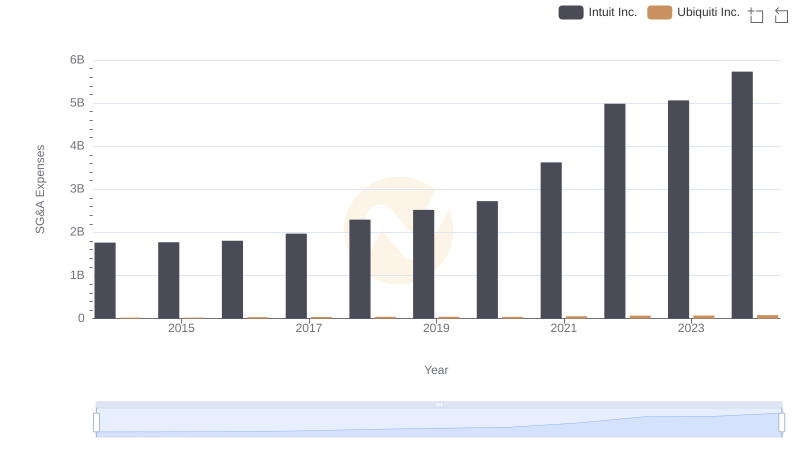
Breaking Down SG&A Expenses: Intuit Inc. vs Ubiquiti Inc.
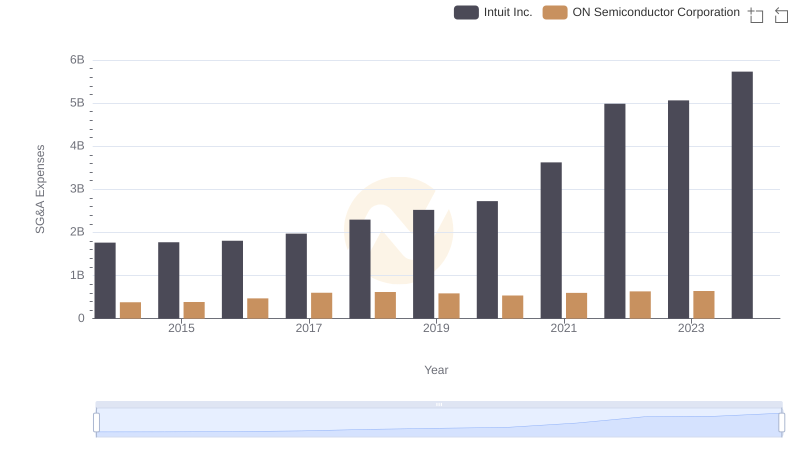
Intuit Inc. vs ON Semiconductor Corporation: SG&A Expense Trends
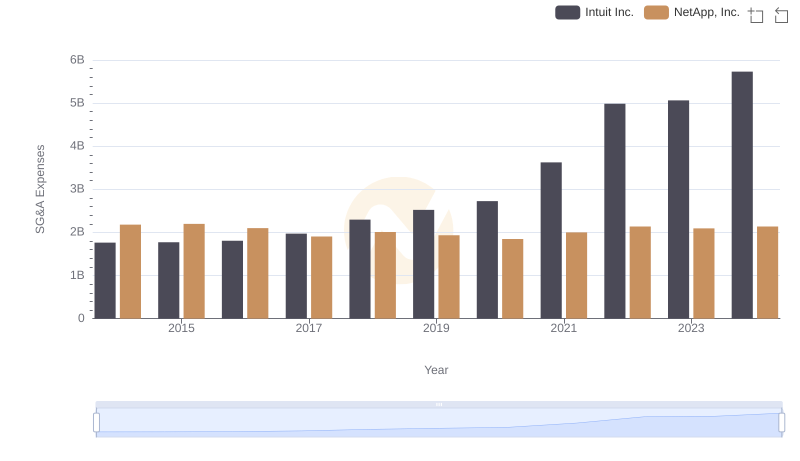
Intuit Inc. or NetApp, Inc.: Who Manages SG&A Costs Better?
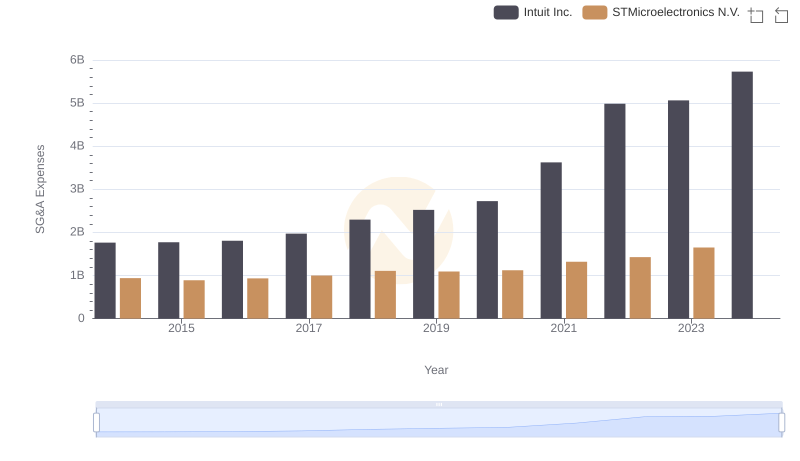
Cost Management Insights: SG&A Expenses for Intuit Inc. and STMicroelectronics N.V.
Intuit Inc. or Western Digital Corporation: Who Manages SG&A Costs Better?

Intuit Inc. and Teledyne Technologies Incorporated: A Detailed Examination of EBITDA Performance