| __timestamp | Intuit Inc. | Ubiquiti Inc. |
|---|---|---|
| Wednesday, January 1, 2014 | 1762000000 | 23560000 |
| Thursday, January 1, 2015 | 1771000000 | 21607000 |
| Friday, January 1, 2016 | 1807000000 | 33269000 |
| Sunday, January 1, 2017 | 1973000000 | 36853000 |
| Monday, January 1, 2018 | 2298000000 | 43121000 |
| Tuesday, January 1, 2019 | 2524000000 | 43237000 |
| Wednesday, January 1, 2020 | 2727000000 | 40569000 |
| Friday, January 1, 2021 | 3626000000 | 53513000 |
| Saturday, January 1, 2022 | 4986000000 | 69859000 |
| Sunday, January 1, 2023 | 5062000000 | 70993000 |
| Monday, January 1, 2024 | 5730000000 | 80997000 |
Data in motion
In the ever-evolving landscape of corporate finance, understanding the nuances of Selling, General, and Administrative (SG&A) expenses is crucial. Over the past decade, Intuit Inc. and Ubiquiti Inc. have showcased contrasting trajectories in their SG&A expenditures.
From 2014 to 2024, Intuit Inc. has seen a remarkable 225% increase in SG&A expenses, reflecting its aggressive growth strategy and expansion efforts. By 2024, Intuit's SG&A expenses reached a staggering $5.73 billion, highlighting its commitment to scaling operations and enhancing customer engagement.
In contrast, Ubiquiti Inc. maintained a more conservative approach, with SG&A expenses growing by approximately 243% over the same period. By 2024, Ubiquiti's expenses were a modest $81 million, underscoring its focus on lean operations and cost efficiency.
This comparison offers a fascinating glimpse into how two companies navigate their financial strategies in a competitive market.
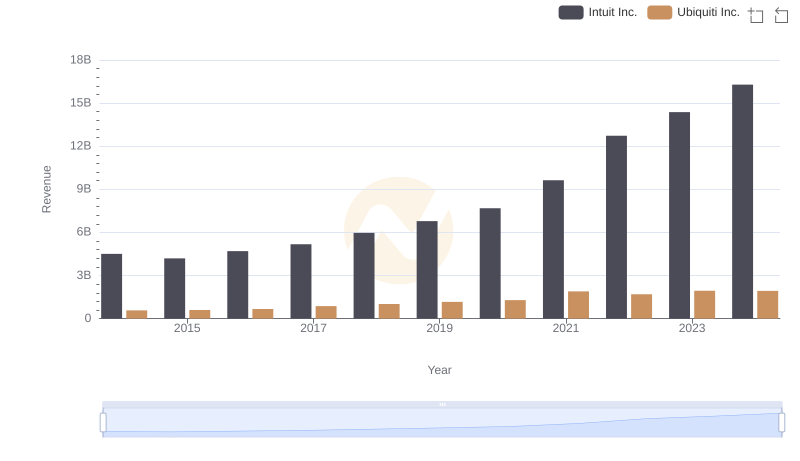
Revenue Insights: Intuit Inc. and Ubiquiti Inc. Performance Compared
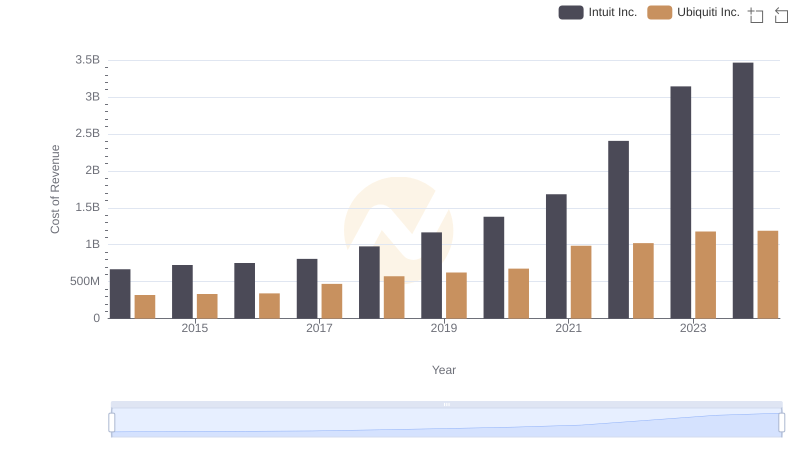
Cost of Revenue Comparison: Intuit Inc. vs Ubiquiti Inc.
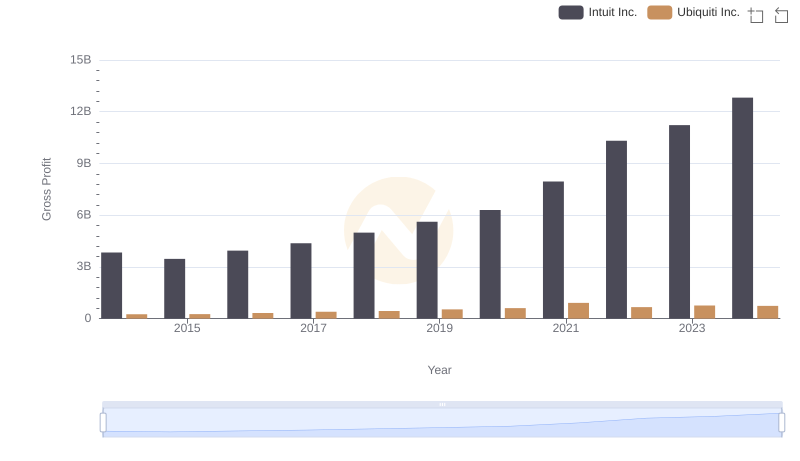
Intuit Inc. and Ubiquiti Inc.: A Detailed Gross Profit Analysis
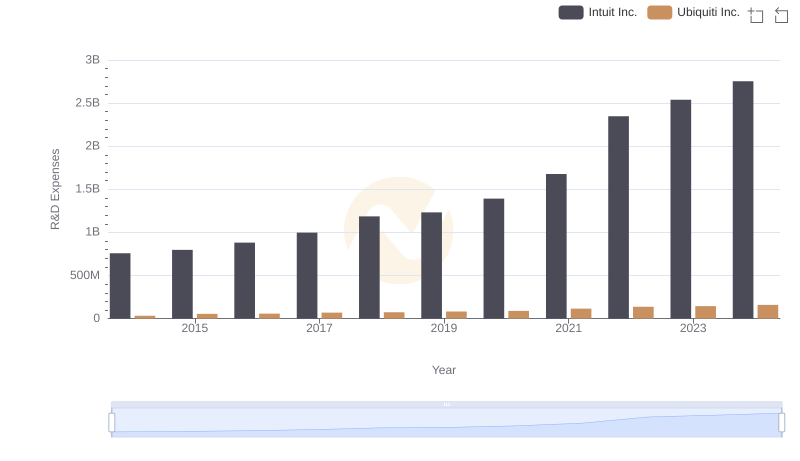
Research and Development: Comparing Key Metrics for Intuit Inc. and Ubiquiti Inc.
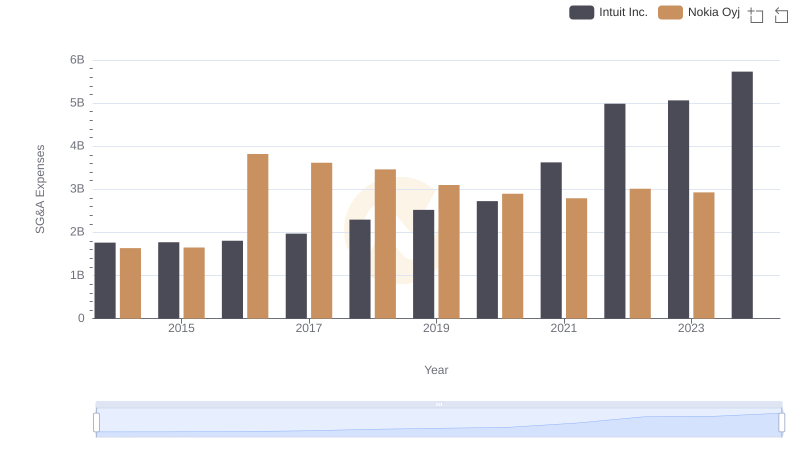
SG&A Efficiency Analysis: Comparing Intuit Inc. and Nokia Oyj

Intuit Inc. vs ON Semiconductor Corporation: SG&A Expense Trends
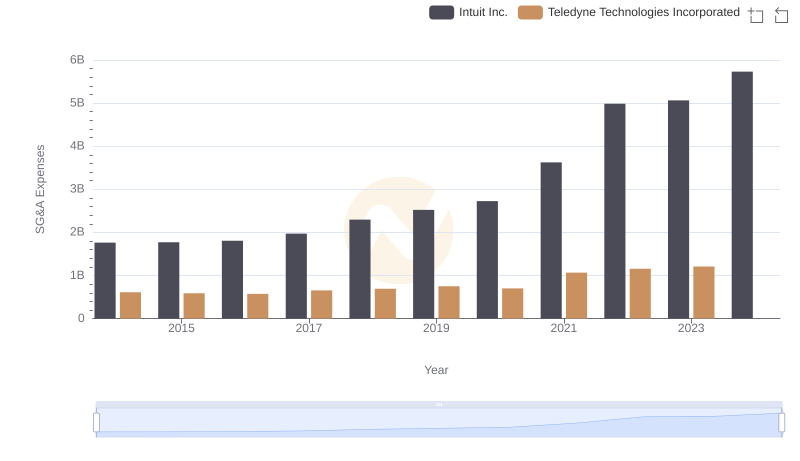
Breaking Down SG&A Expenses: Intuit Inc. vs Teledyne Technologies Incorporated
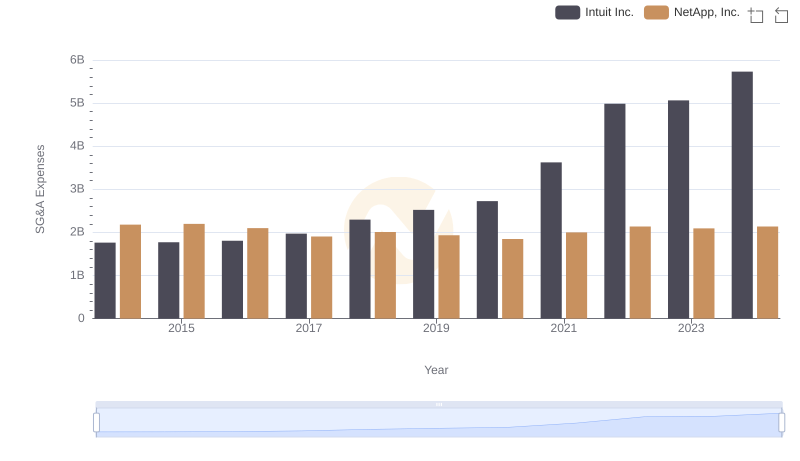
Intuit Inc. or NetApp, Inc.: Who Manages SG&A Costs Better?
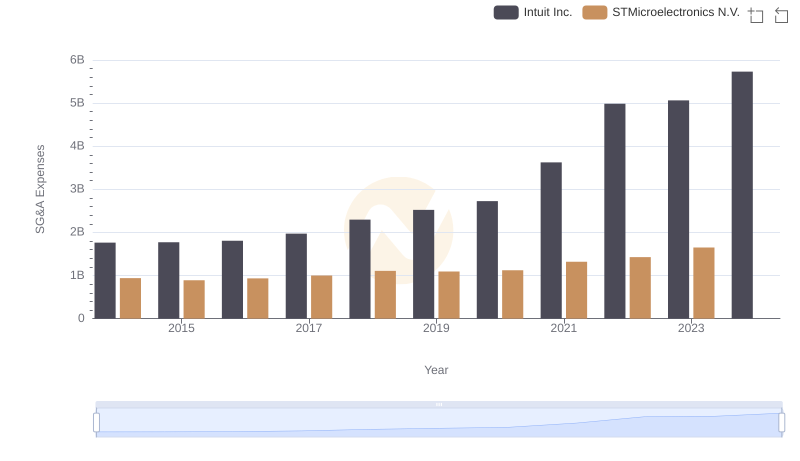
Cost Management Insights: SG&A Expenses for Intuit Inc. and STMicroelectronics N.V.
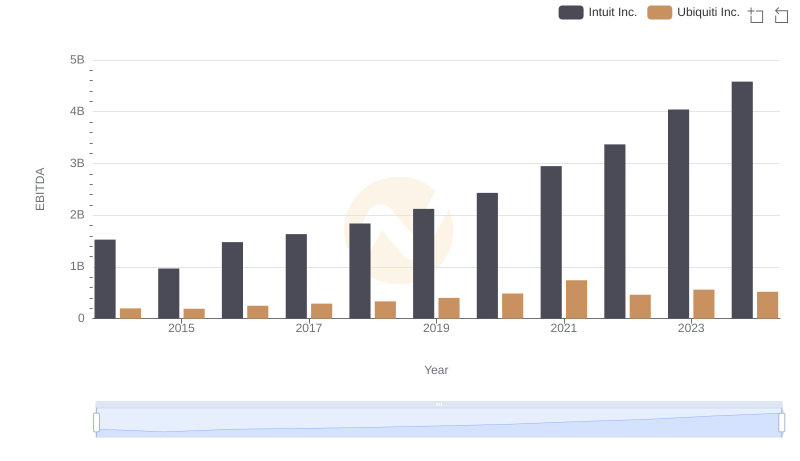
A Professional Review of EBITDA: Intuit Inc. Compared to Ubiquiti Inc.
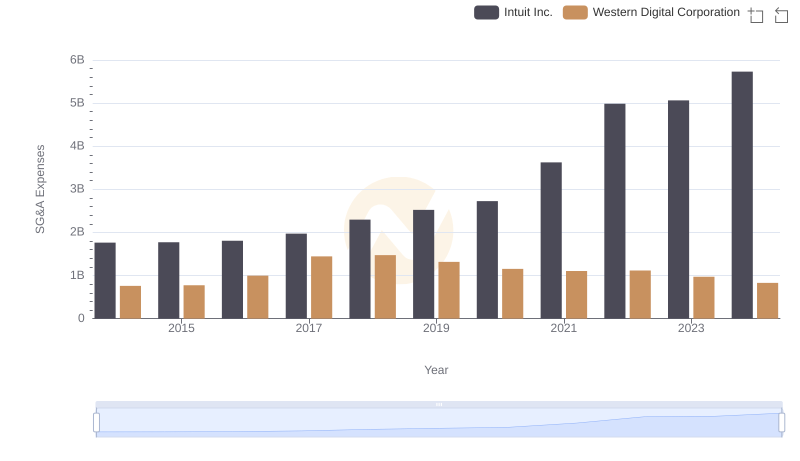
Intuit Inc. or Western Digital Corporation: Who Manages SG&A Costs Better?