| __timestamp | II-VI Incorporated | International Business Machines Corporation |
|---|---|---|
| Wednesday, January 1, 2014 | 226716000 | 46407000000 |
| Thursday, January 1, 2015 | 271598000 | 40684000000 |
| Friday, January 1, 2016 | 312813000 | 38516000000 |
| Sunday, January 1, 2017 | 388353000 | 36943000000 |
| Monday, January 1, 2018 | 462203000 | 36936000000 |
| Tuesday, January 1, 2019 | 521349000 | 31533000000 |
| Wednesday, January 1, 2020 | 819550000 | 30865000000 |
| Friday, January 1, 2021 | 1216213000 | 31486000000 |
| Saturday, January 1, 2022 | 1265496000 | 32687000000 |
| Sunday, January 1, 2023 | 1618283000 | 34300000000 |
| Monday, January 1, 2024 | 1455964000 | 35551000000 |
Unleashing the power of data
In the ever-evolving landscape of technology and manufacturing, the financial trajectories of International Business Machines Corporation (IBM) and II-VI Incorporated offer a fascinating study. Over the past decade, IBM, a stalwart in the tech industry, has seen its gross profit fluctuate, peaking in 2014 and experiencing a gradual decline to 2023. Despite this, IBM's gross profit remains robust, averaging around $36 billion annually.
Conversely, II-VI Incorporated, a leader in engineered materials and optoelectronic components, has demonstrated a remarkable growth trajectory. From 2014 to 2023, II-VI's gross profit surged by over 600%, reflecting its strategic expansions and market adaptability. By 2023, II-VI's gross profit reached approximately $1.6 billion, showcasing its dynamic growth in a competitive market.
This comparison underscores the diverse strategies and market positions of these two industry leaders, offering valuable insights into their financial health and future prospects.
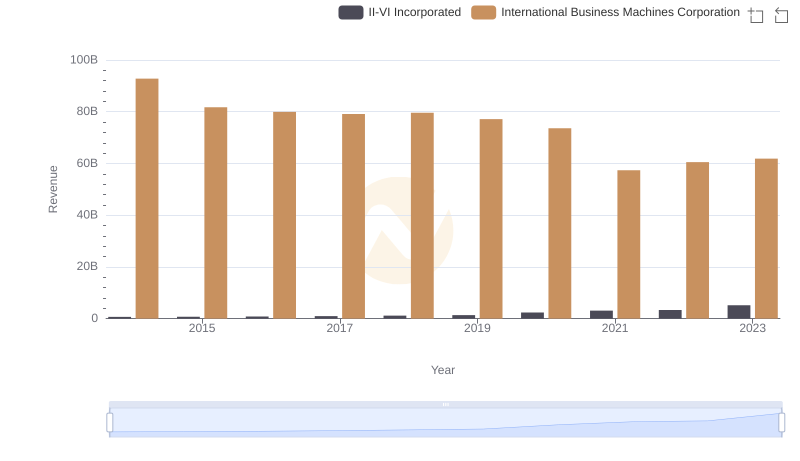
Breaking Down Revenue Trends: International Business Machines Corporation vs II-VI Incorporated
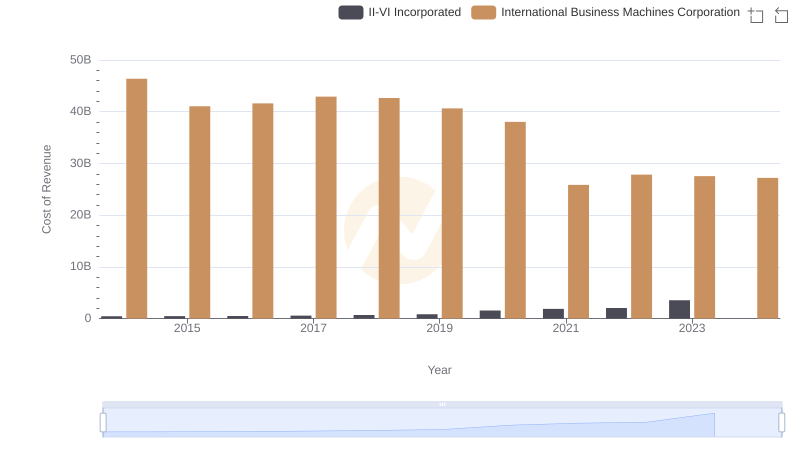
Analyzing Cost of Revenue: International Business Machines Corporation and II-VI Incorporated
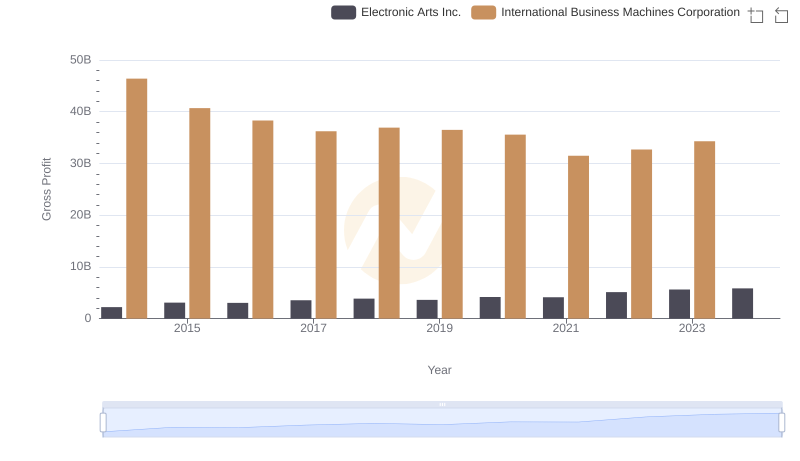
International Business Machines Corporation vs Electronic Arts Inc.: A Gross Profit Performance Breakdown
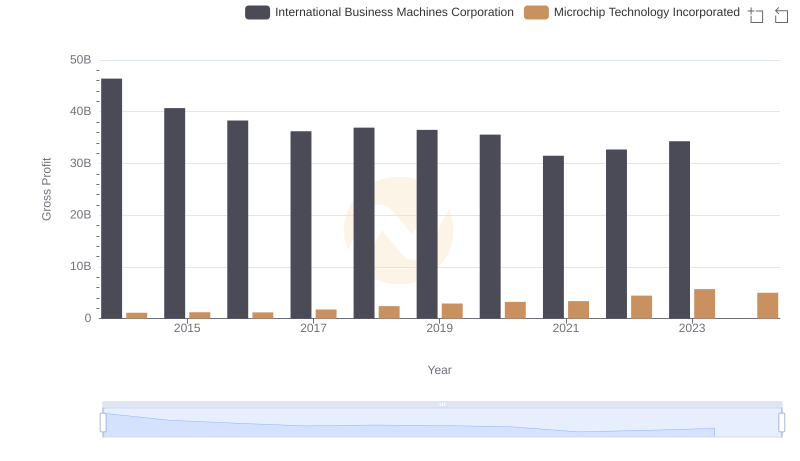
Gross Profit Analysis: Comparing International Business Machines Corporation and Microchip Technology Incorporated
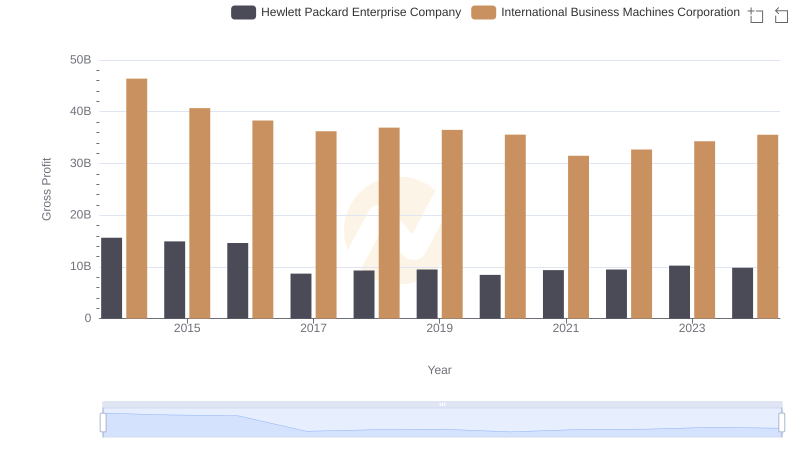
Gross Profit Analysis: Comparing International Business Machines Corporation and Hewlett Packard Enterprise Company
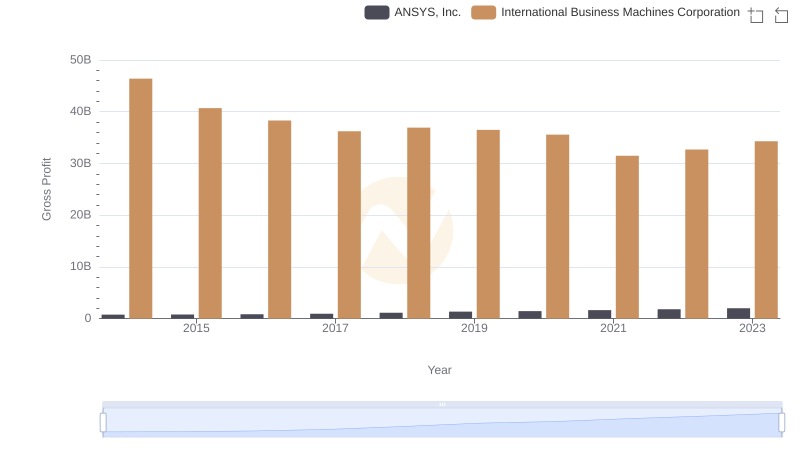
Gross Profit Comparison: International Business Machines Corporation and ANSYS, Inc. Trends
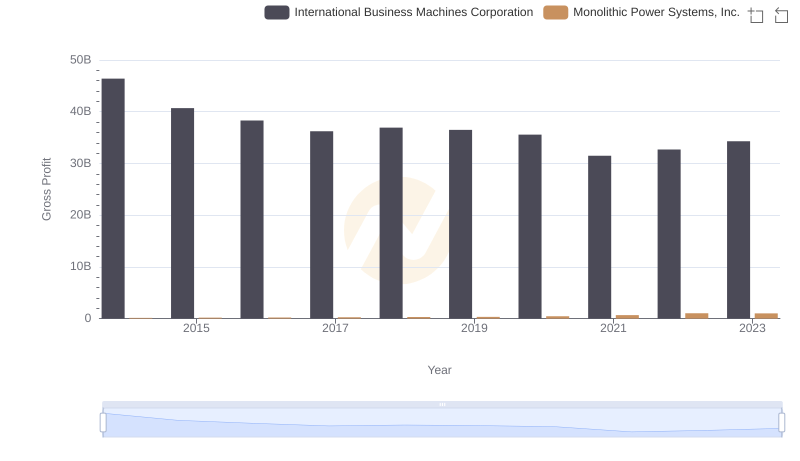
Key Insights on Gross Profit: International Business Machines Corporation vs Monolithic Power Systems, Inc.
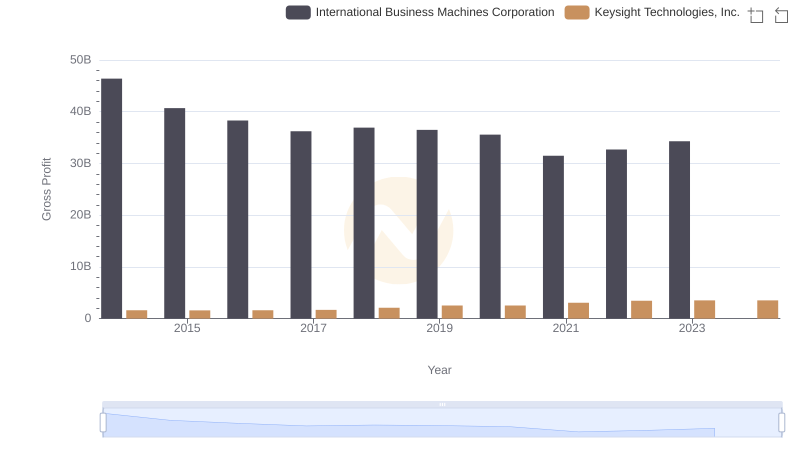
International Business Machines Corporation and Keysight Technologies, Inc.: A Detailed Gross Profit Analysis
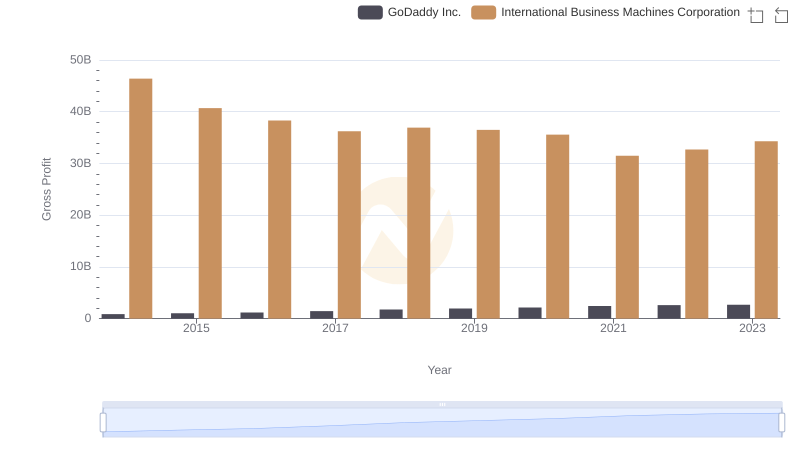
Gross Profit Comparison: International Business Machines Corporation and GoDaddy Inc. Trends
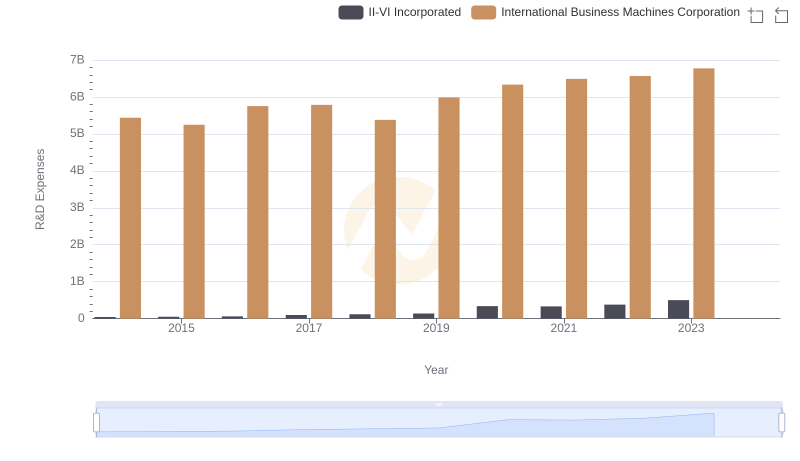
Research and Development Investment: International Business Machines Corporation vs II-VI Incorporated
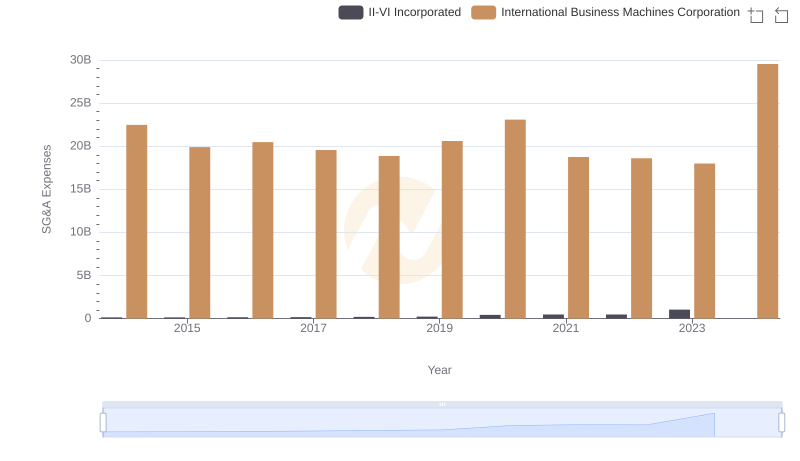
SG&A Efficiency Analysis: Comparing International Business Machines Corporation and II-VI Incorporated
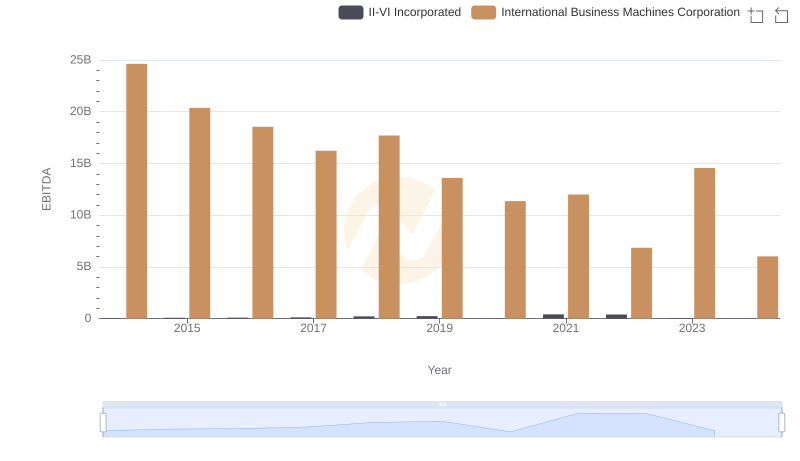
A Professional Review of EBITDA: International Business Machines Corporation Compared to II-VI Incorporated