| __timestamp | International Business Machines Corporation | Take-Two Interactive Software, Inc. |
|---|---|---|
| Wednesday, January 1, 2014 | 46407000000 | 936241000 |
| Thursday, January 1, 2015 | 40684000000 | 288071000 |
| Friday, January 1, 2016 | 38516000000 | 599825000 |
| Sunday, January 1, 2017 | 36943000000 | 756789000 |
| Monday, January 1, 2018 | 36936000000 | 894581000 |
| Tuesday, January 1, 2019 | 31533000000 | 1144750000 |
| Wednesday, January 1, 2020 | 30865000000 | 1546520000 |
| Friday, January 1, 2021 | 31486000000 | 1837687000 |
| Saturday, January 1, 2022 | 32687000000 | 1969399000 |
| Sunday, January 1, 2023 | 34300000000 | 2285300000 |
| Monday, January 1, 2024 | 35551000000 | 2241800000 |
Unleashing insights
In the ever-evolving landscape of technology and entertainment, International Business Machines Corporation (IBM) and Take-Two Interactive Software, Inc. stand as titans in their respective fields. Over the past decade, IBM's gross profit has seen a decline of approximately 26%, from a peak in 2014 to a low in 2021. This trend reflects the challenges faced by traditional tech companies in adapting to new market demands. Meanwhile, Take-Two Interactive, a leader in the gaming industry, has experienced a remarkable growth of over 140% in gross profit during the same period, highlighting the booming demand for interactive entertainment.
As of 2023, IBM's gross profit shows signs of recovery, increasing by about 9% from its 2021 low, while Take-Two continues its upward trajectory, albeit at a slower pace. This analysis underscores the dynamic shifts in the tech and entertainment sectors, offering valuable insights for investors and industry enthusiasts alike.
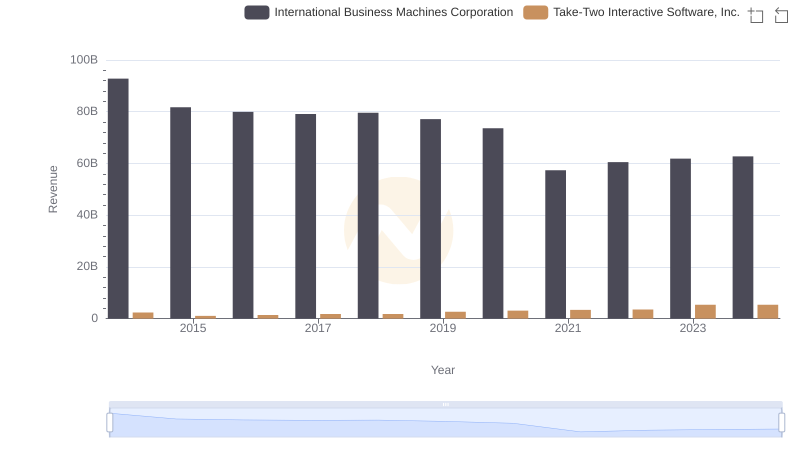
Breaking Down Revenue Trends: International Business Machines Corporation vs Take-Two Interactive Software, Inc.
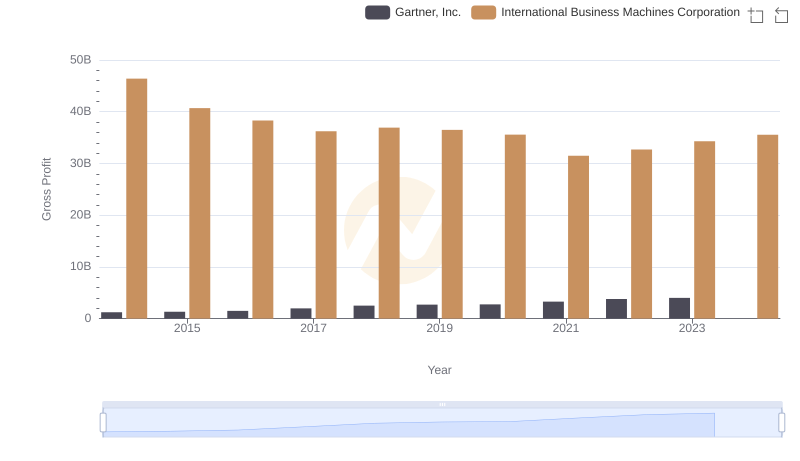
Who Generates Higher Gross Profit? International Business Machines Corporation or Gartner, Inc.
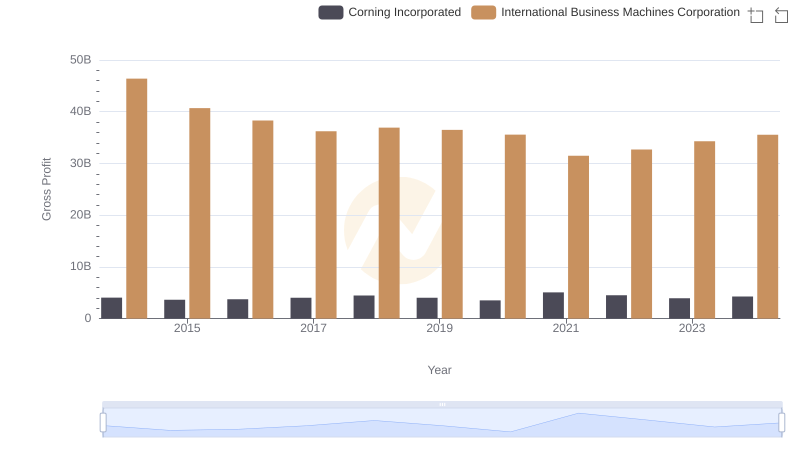
Key Insights on Gross Profit: International Business Machines Corporation vs Corning Incorporated
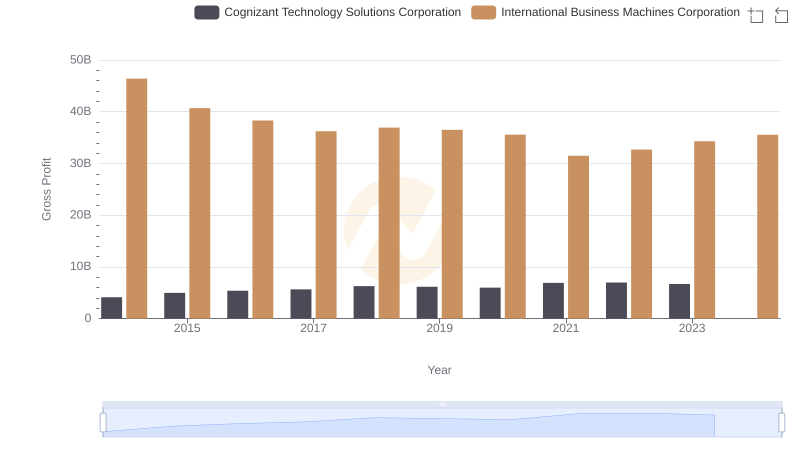
International Business Machines Corporation vs Cognizant Technology Solutions Corporation: A Gross Profit Performance Breakdown
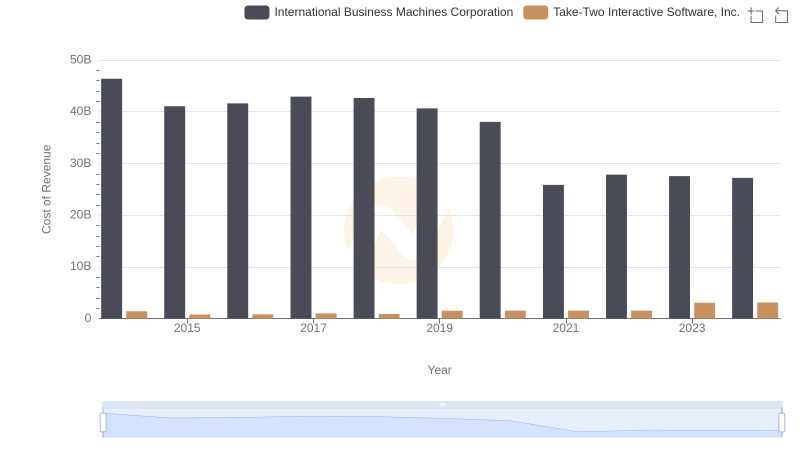
Cost of Revenue: Key Insights for International Business Machines Corporation and Take-Two Interactive Software, Inc.
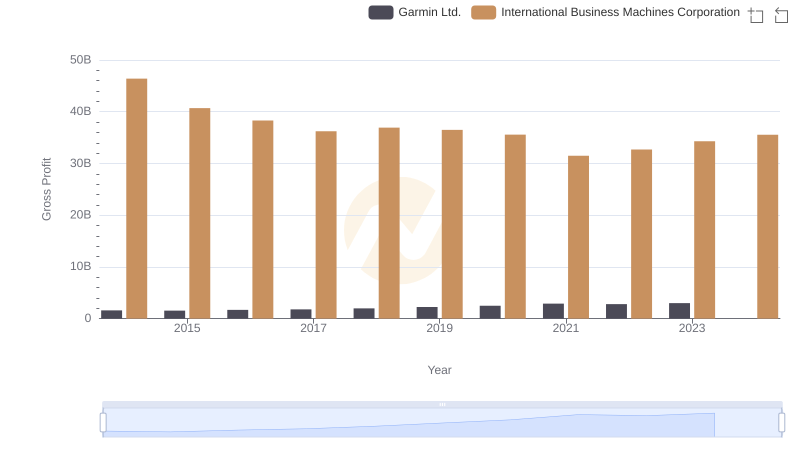
Gross Profit Trends Compared: International Business Machines Corporation vs Garmin Ltd.
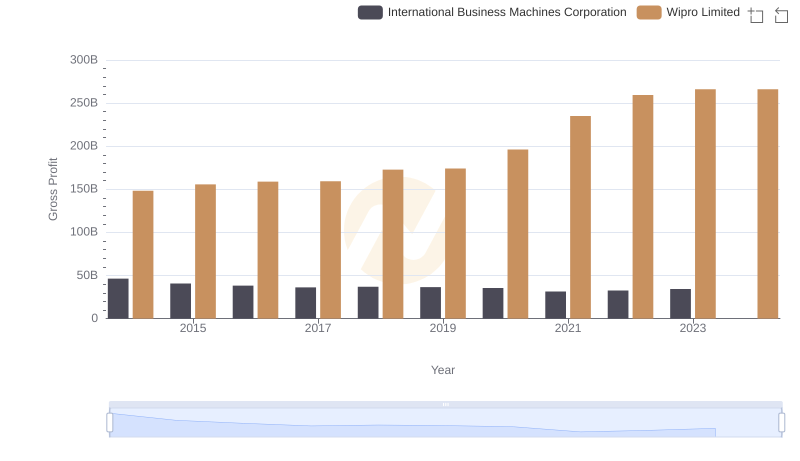
Who Generates Higher Gross Profit? International Business Machines Corporation or Wipro Limited
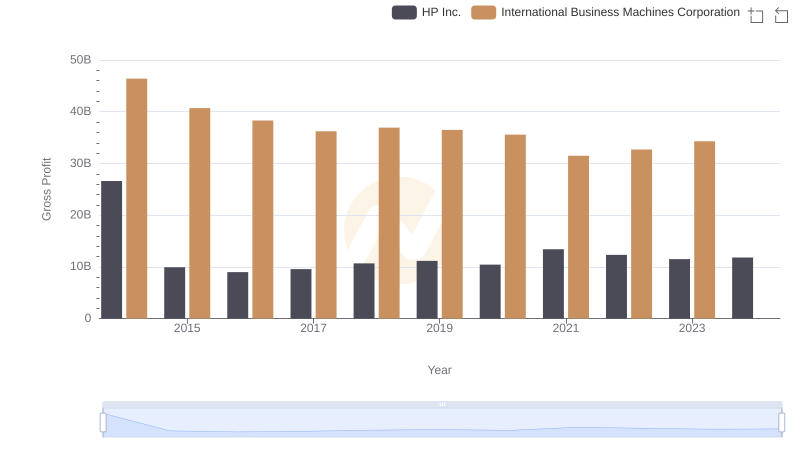
Key Insights on Gross Profit: International Business Machines Corporation vs HP Inc.
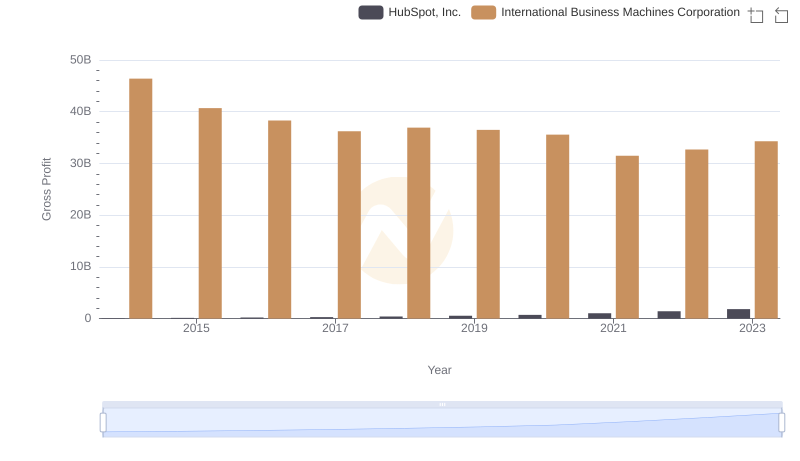
Gross Profit Trends Compared: International Business Machines Corporation vs HubSpot, Inc.
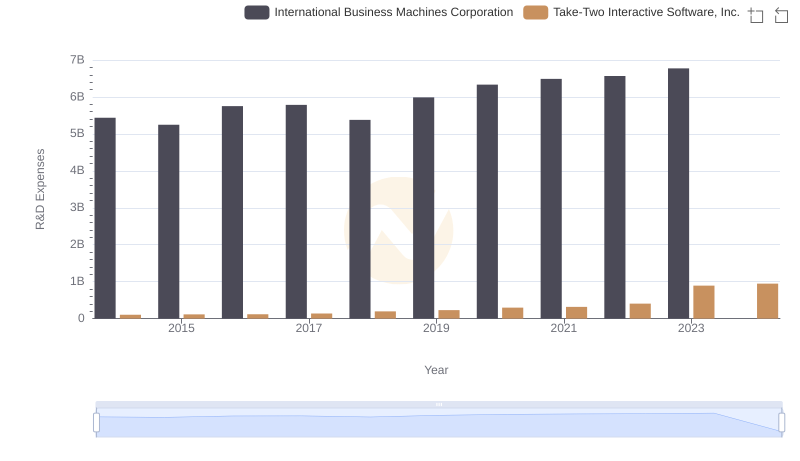
Research and Development Expenses Breakdown: International Business Machines Corporation vs Take-Two Interactive Software, Inc.
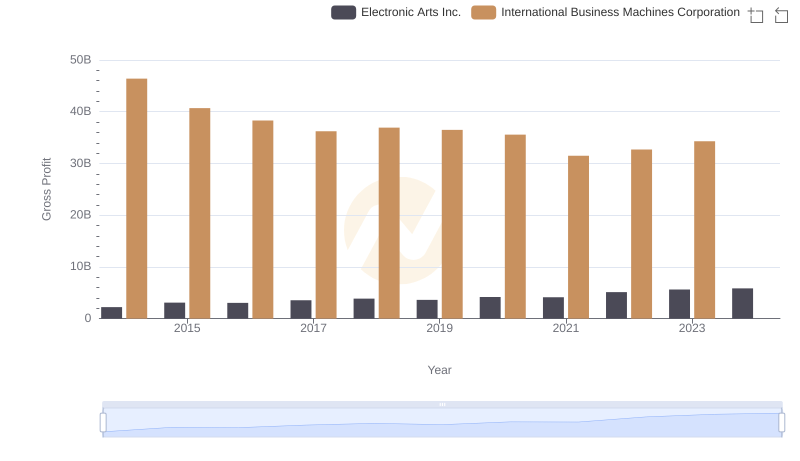
International Business Machines Corporation vs Electronic Arts Inc.: A Gross Profit Performance Breakdown
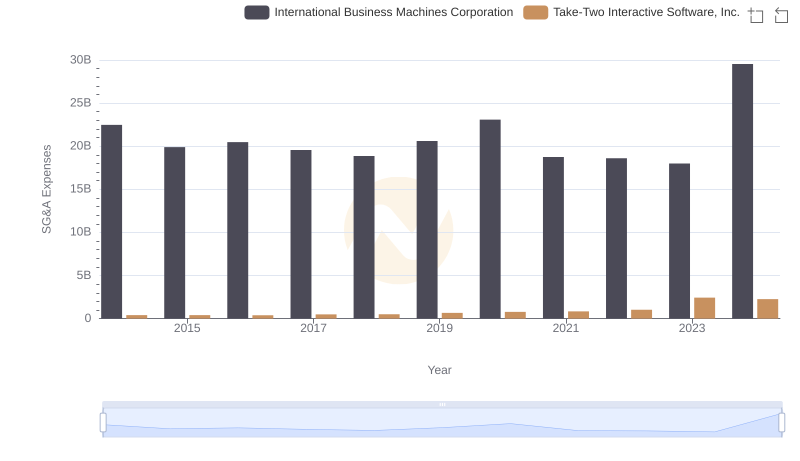
Who Optimizes SG&A Costs Better? International Business Machines Corporation or Take-Two Interactive Software, Inc.