| __timestamp | International Business Machines Corporation | Take-Two Interactive Software, Inc. |
|---|---|---|
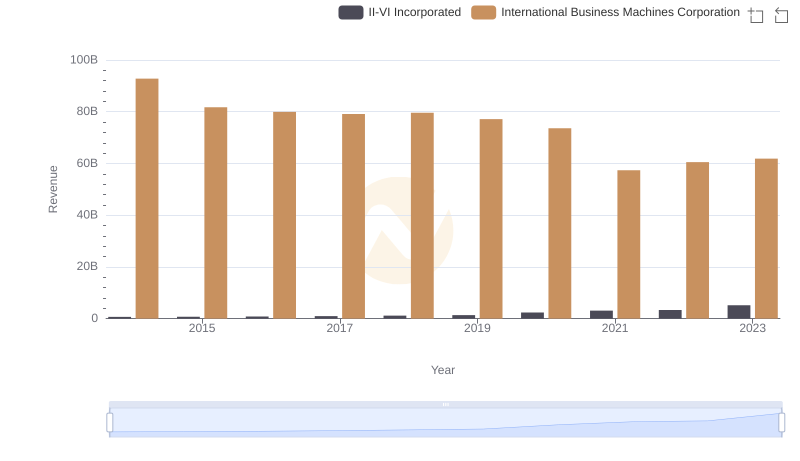
| Wednesday, January 1, 2014 | 92793000000 | 2350568000 |
| Thursday, January 1, 2015 | 81742000000 | 1082938000 |
| Friday, January 1, 2016 | 79920000000 | 1413698000 |
| Sunday, January 1, 2017 | 79139000000 | 1779748000 |
| Monday, January 1, 2018 | 79591000000 | 1792892000 |
| Tuesday, January 1, 2019 | 57714000000 | 2668394000 |
| Wednesday, January 1, 2020 | 55179000000 | 3088970000 |
| Friday, January 1, 2021 | 57351000000 | 3372772000 |
| Saturday, January 1, 2022 | 60530000000 | 3504800000 |
| Sunday, January 1, 2023 | 61860000000 | 5349900000 |
| Monday, January 1, 2024 | 62753000000 | 5349600000 |
Unveiling the hidden dimensions of data
In the ever-evolving landscape of technology and entertainment, the revenue trajectories of International Business Machines Corporation (IBM) and Take-Two Interactive Software, Inc. offer a fascinating study. Over the past decade, IBM, a stalwart in the tech industry, has seen its annual revenue decline by approximately 32%, from a peak in 2014 to 2024. This trend reflects the broader challenges faced by traditional tech giants in adapting to new market dynamics.
Conversely, Take-Two Interactive, a leader in the gaming industry, has experienced a remarkable revenue growth of over 128% during the same period. This surge underscores the increasing consumer demand for interactive entertainment and digital experiences. By 2023, Take-Two's revenue reached a new high, highlighting its successful adaptation to the digital age.
These contrasting trends illustrate the shifting paradigms in technology and entertainment, where innovation and adaptability are key to sustained growth.
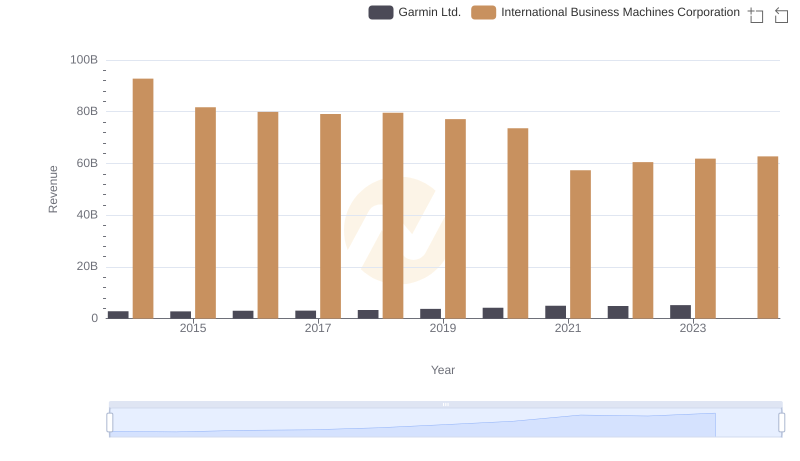
International Business Machines Corporation vs Garmin Ltd.: Examining Key Revenue Metrics
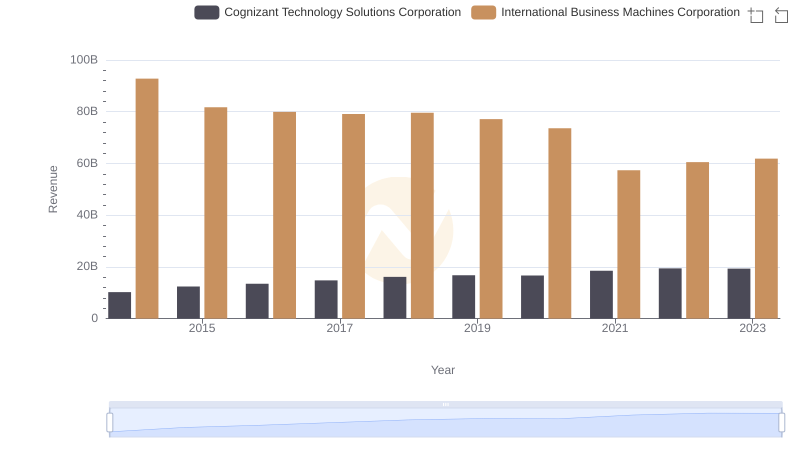
Breaking Down Revenue Trends: International Business Machines Corporation vs Cognizant Technology Solutions Corporation
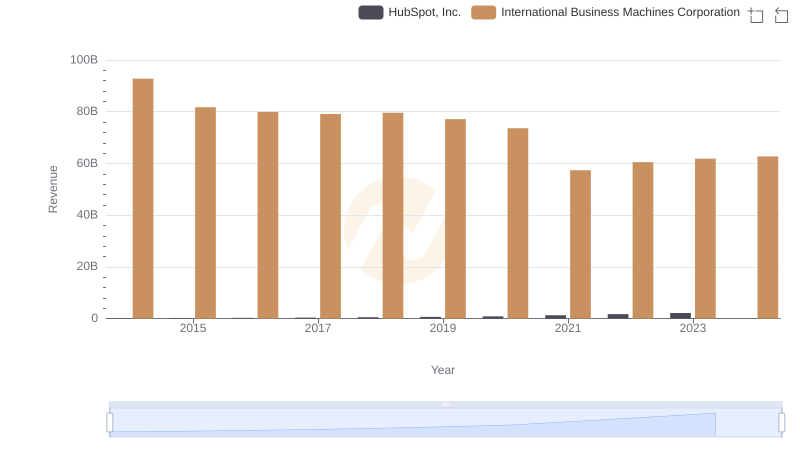
Who Generates More Revenue? International Business Machines Corporation or HubSpot, Inc.
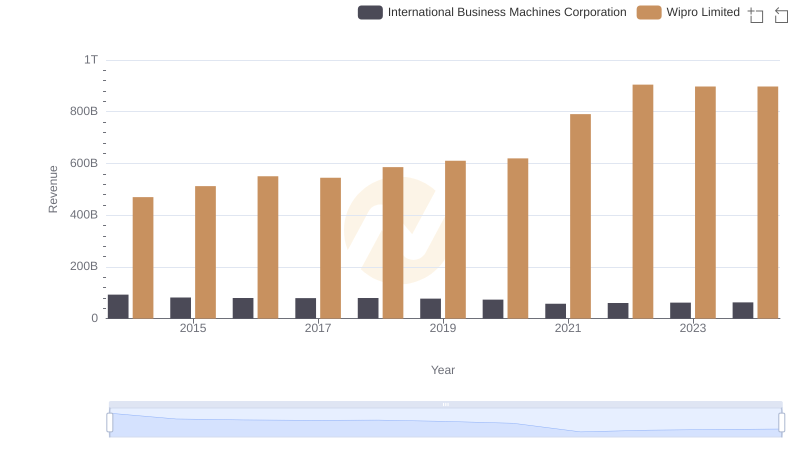
International Business Machines Corporation vs Wipro Limited: Examining Key Revenue Metrics
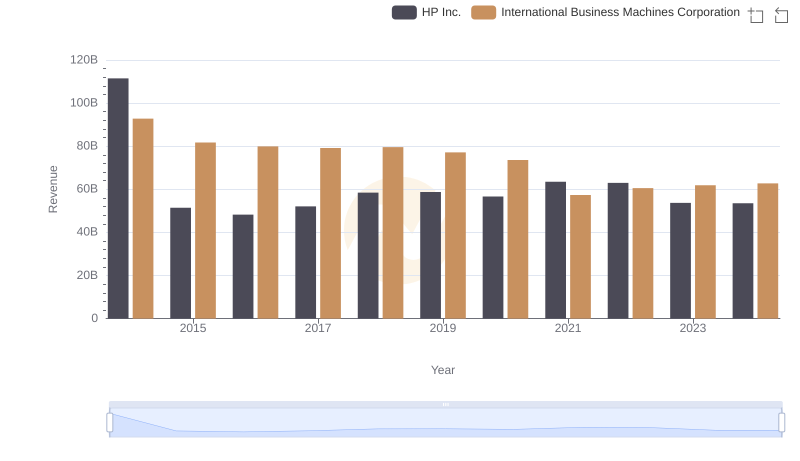
International Business Machines Corporation and HP Inc.: A Comprehensive Revenue Analysis
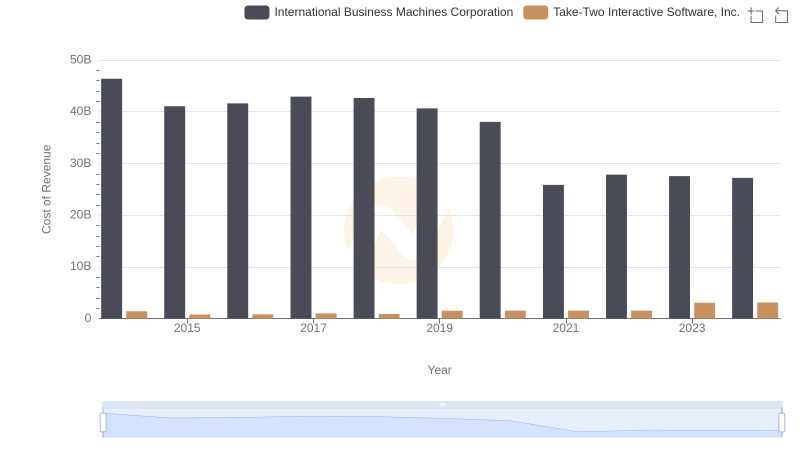
Cost of Revenue: Key Insights for International Business Machines Corporation and Take-Two Interactive Software, Inc.
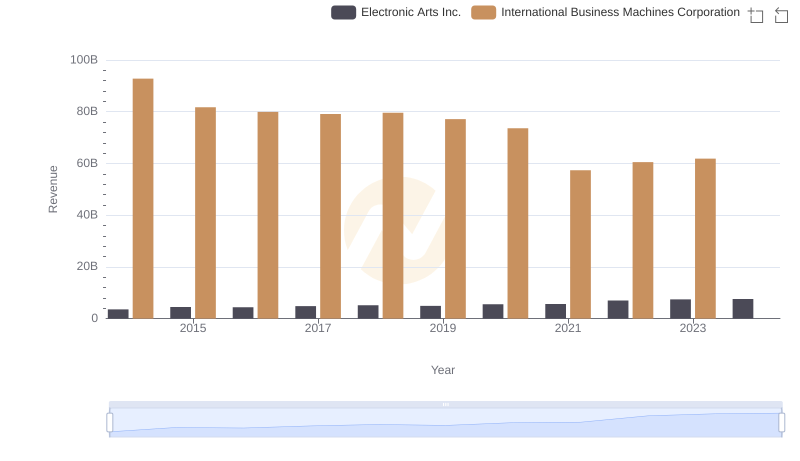
Comparing Revenue Performance: International Business Machines Corporation or Electronic Arts Inc.?
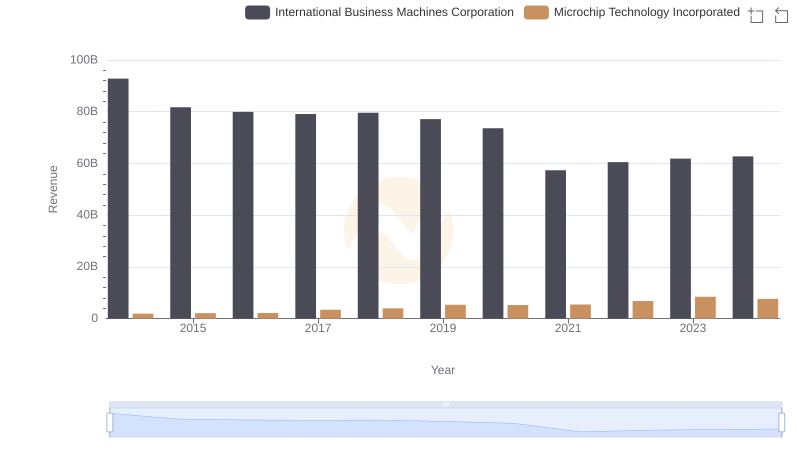
Annual Revenue Comparison: International Business Machines Corporation vs Microchip Technology Incorporated
Breaking Down Revenue Trends: International Business Machines Corporation vs II-VI Incorporated
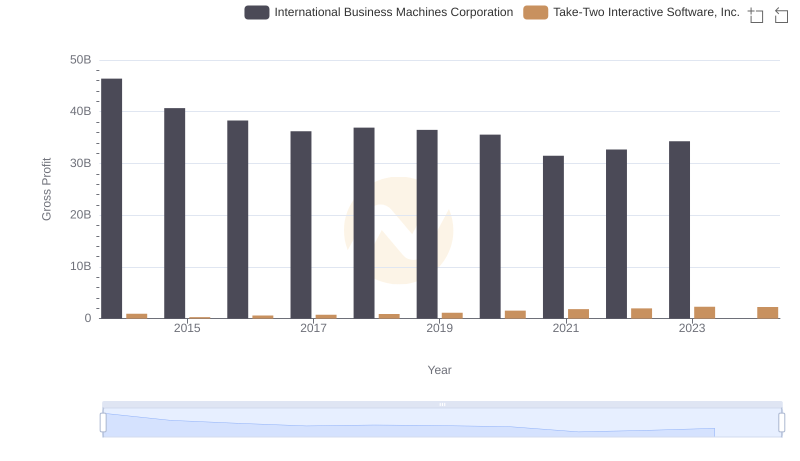
International Business Machines Corporation and Take-Two Interactive Software, Inc.: A Detailed Gross Profit Analysis
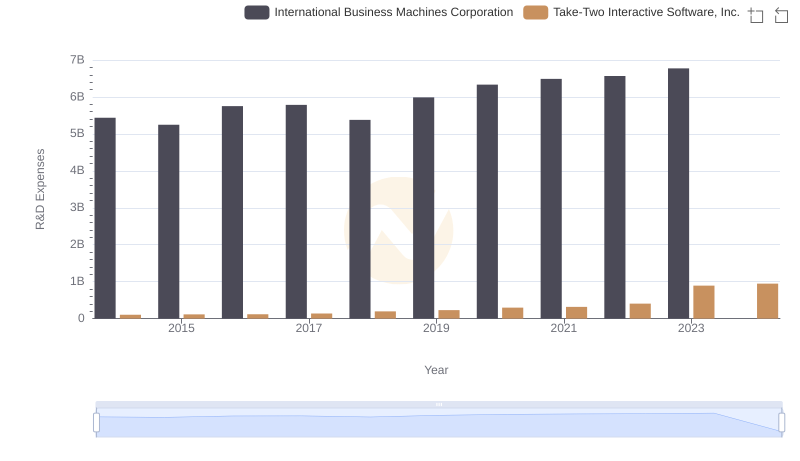
Research and Development Expenses Breakdown: International Business Machines Corporation vs Take-Two Interactive Software, Inc.
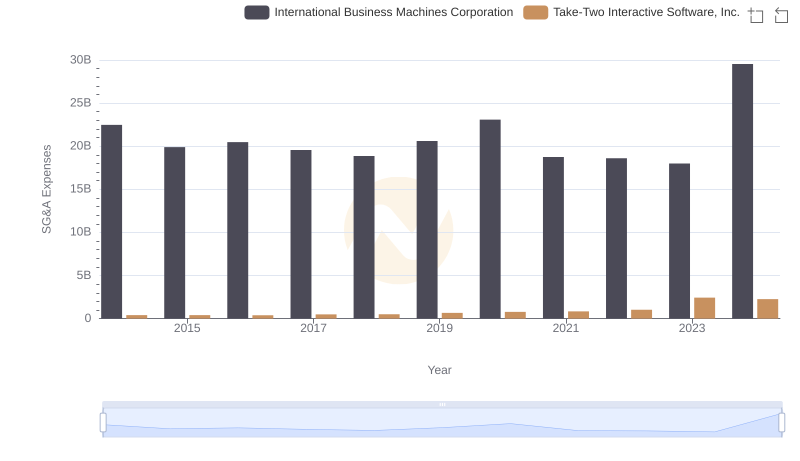
Who Optimizes SG&A Costs Better? International Business Machines Corporation or Take-Two Interactive Software, Inc.