| __timestamp | Infosys Limited | Nokia Oyj |
|---|---|---|
| Wednesday, January 1, 2014 | 2258000000 | 1689000000 |
| Thursday, January 1, 2015 | 2590000000 | 2008000000 |
| Friday, January 1, 2016 | 2765000000 | 542000000 |
| Sunday, January 1, 2017 | 2936000000 | 1590000000 |
| Monday, January 1, 2018 | 2984000000 | 1377000000 |
| Tuesday, January 1, 2019 | 3053000000 | 2474000000 |
| Wednesday, January 1, 2020 | 4053342784 | 2050000000 |
| Friday, January 1, 2021 | 4116000000 | 3227000000 |
| Saturday, January 1, 2022 | 4707334610 | 3546000000 |
| Sunday, January 1, 2023 | 4206000000 | 2944000000 |
Infusing magic into the data realm
In the ever-evolving tech landscape, Infosys Limited and Nokia Oyj have been pivotal players. Over the past decade, Infosys has consistently outperformed Nokia in terms of EBITDA, showcasing a robust growth trajectory. From 2014 to 2023, Infosys's EBITDA surged by approximately 86%, peaking in 2022. In contrast, Nokia's EBITDA exhibited more volatility, with a notable dip in 2016, but managed a recovery by 2022, achieving a 110% increase from its lowest point.
This comparison highlights the resilience and strategic prowess of these tech giants, offering valuable insights into their financial health and market strategies.
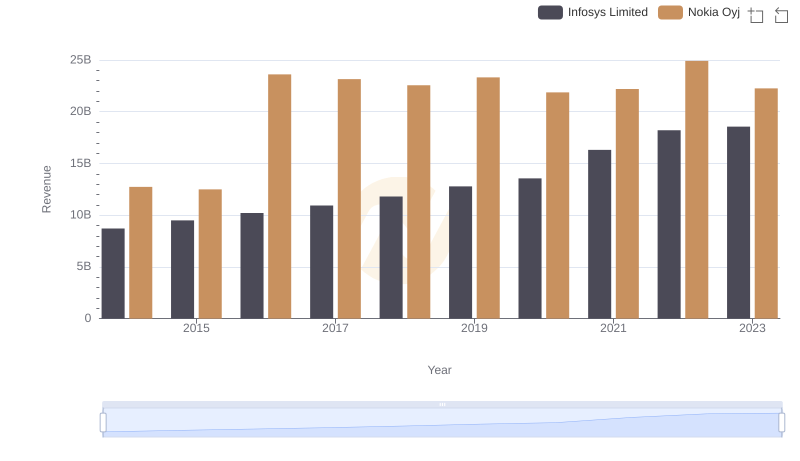
Who Generates More Revenue? Infosys Limited or Nokia Oyj
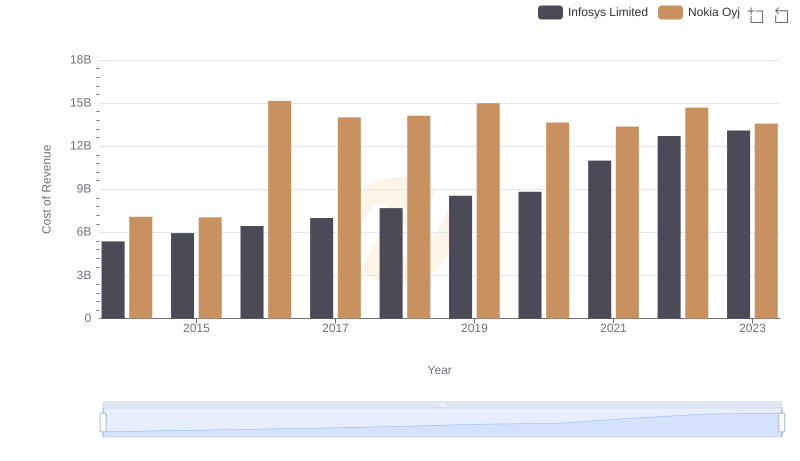
Cost Insights: Breaking Down Infosys Limited and Nokia Oyj's Expenses
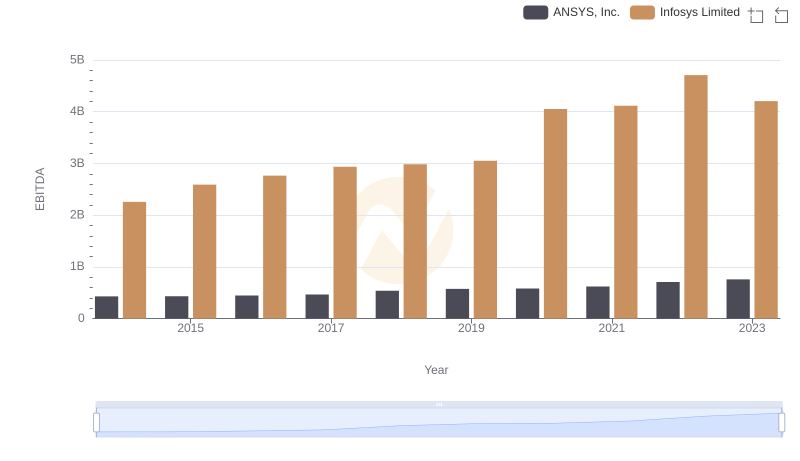
EBITDA Performance Review: Infosys Limited vs ANSYS, Inc.
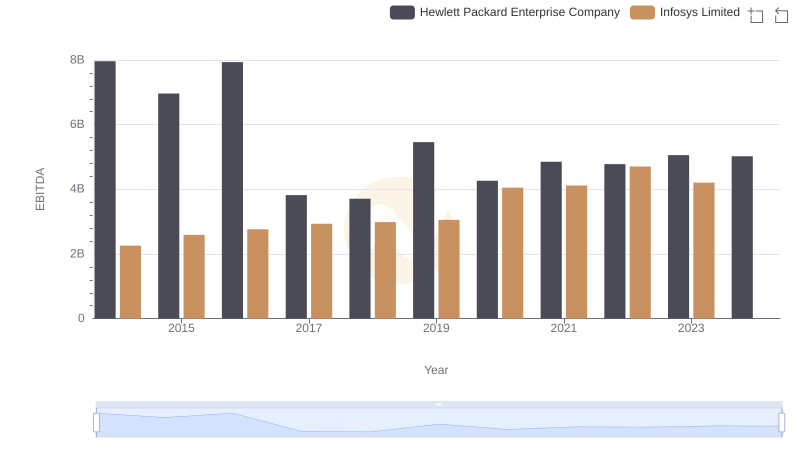
EBITDA Performance Review: Infosys Limited vs Hewlett Packard Enterprise Company
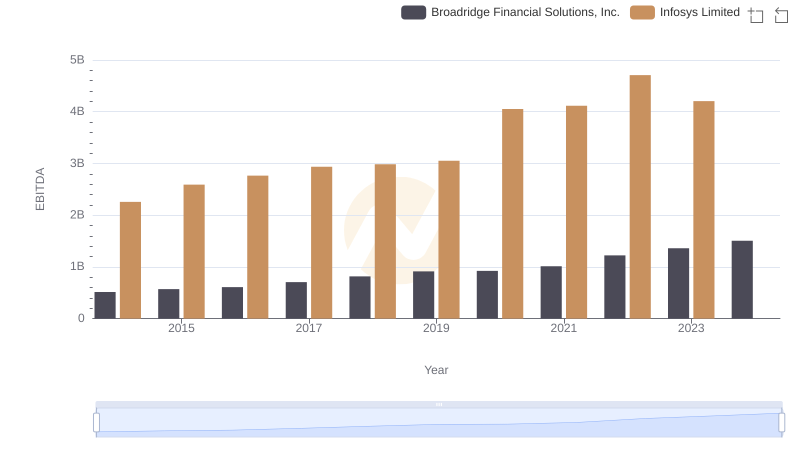
Infosys Limited and Broadridge Financial Solutions, Inc.: A Detailed Examination of EBITDA Performance
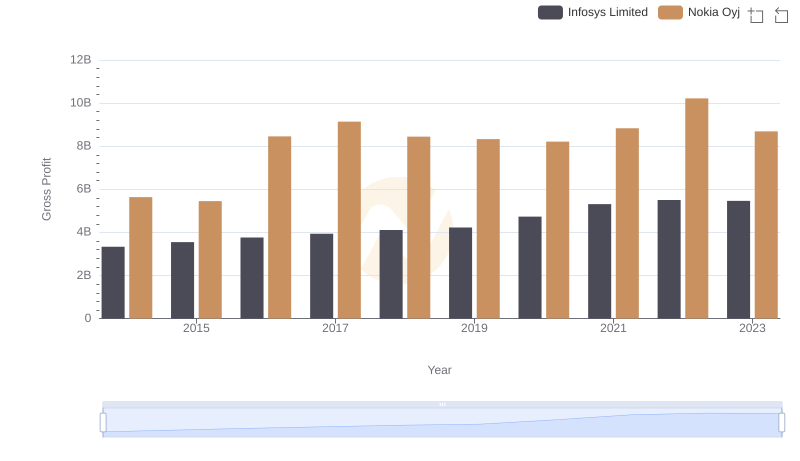
Key Insights on Gross Profit: Infosys Limited vs Nokia Oyj
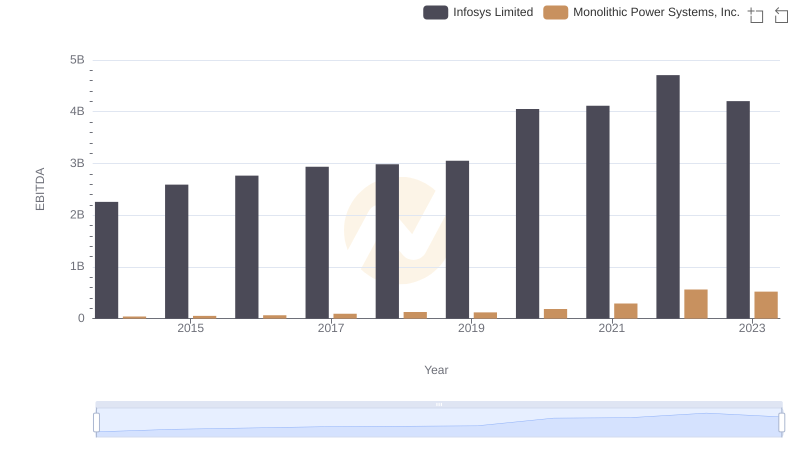
Comparative EBITDA Analysis: Infosys Limited vs Monolithic Power Systems, Inc.
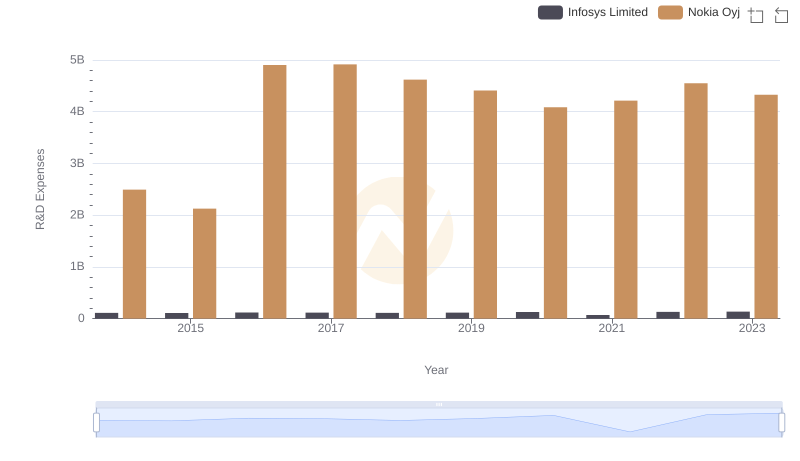
R&D Spending Showdown: Infosys Limited vs Nokia Oyj
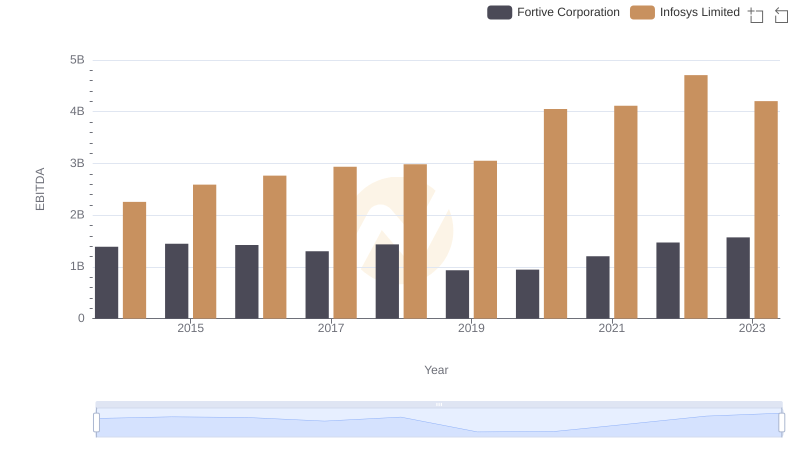
Comprehensive EBITDA Comparison: Infosys Limited vs Fortive Corporation
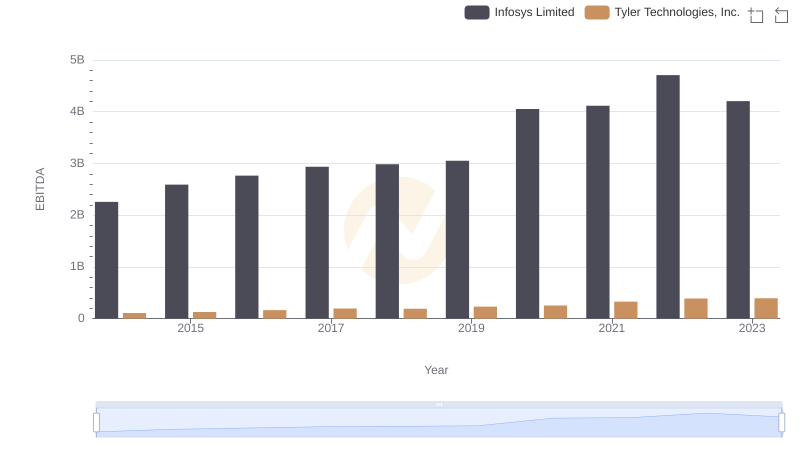
Comprehensive EBITDA Comparison: Infosys Limited vs Tyler Technologies, Inc.
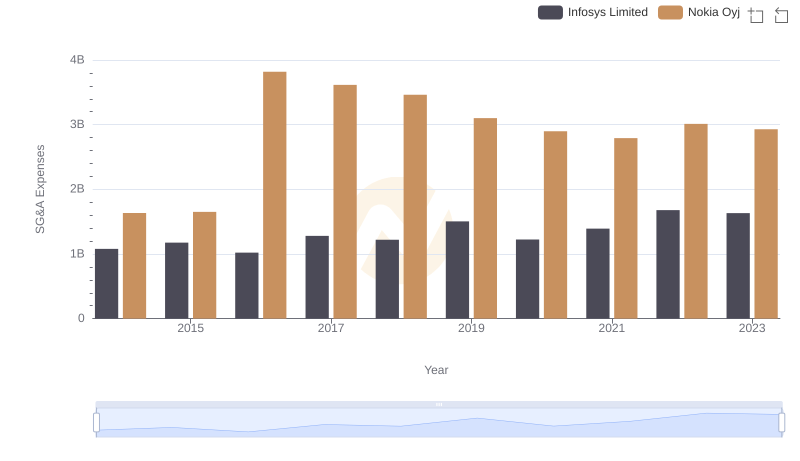
Infosys Limited and Nokia Oyj: SG&A Spending Patterns Compared
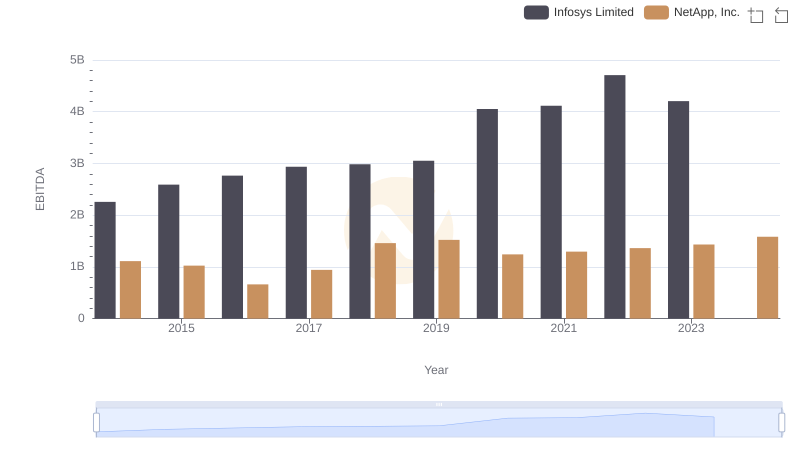
EBITDA Performance Review: Infosys Limited vs NetApp, Inc.