| __timestamp | Infosys Limited | Nokia Oyj |
|---|---|---|
| Wednesday, January 1, 2014 | 1079000000 | 1634000000 |
| Thursday, January 1, 2015 | 1176000000 | 1651000000 |
| Friday, January 1, 2016 | 1020000000 | 3819000000 |
| Sunday, January 1, 2017 | 1279000000 | 3615000000 |
| Monday, January 1, 2018 | 1220000000 | 3463000000 |
| Tuesday, January 1, 2019 | 1504000000 | 3101000000 |
| Wednesday, January 1, 2020 | 1223000000 | 2898000000 |
| Friday, January 1, 2021 | 1391000000 | 2792000000 |
| Saturday, January 1, 2022 | 1678000000 | 3013000000 |
| Sunday, January 1, 2023 | 1632000000 | 2929000000 |
Cracking the code
In the ever-evolving landscape of global technology, understanding the financial strategies of industry leaders is crucial. This analysis delves into the Selling, General, and Administrative (SG&A) expenses of Infosys Limited and Nokia Oyj from 2014 to 2023. Over this decade, Nokia consistently outspent Infosys, with its SG&A expenses peaking in 2016 at nearly double that of Infosys. However, Infosys demonstrated a steady growth trajectory, with a notable 55% increase in SG&A expenses from 2014 to 2023. This trend reflects Infosys's strategic investments in expanding its global footprint and enhancing operational efficiencies. Meanwhile, Nokia's fluctuating expenses highlight its adaptive strategies in response to market dynamics. As these tech titans navigate the future, their SG&A spending patterns offer a window into their evolving business priorities and market strategies.
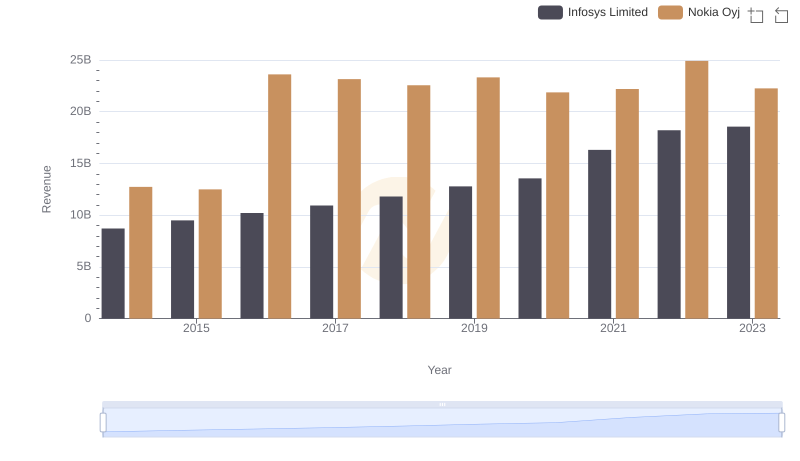
Who Generates More Revenue? Infosys Limited or Nokia Oyj
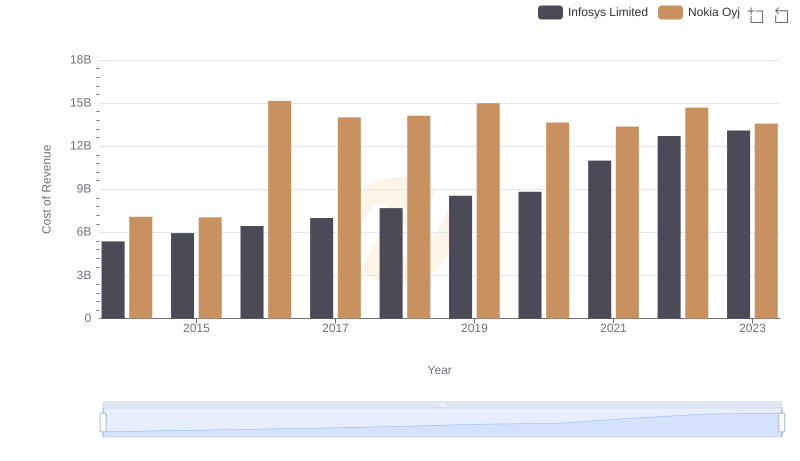
Cost Insights: Breaking Down Infosys Limited and Nokia Oyj's Expenses
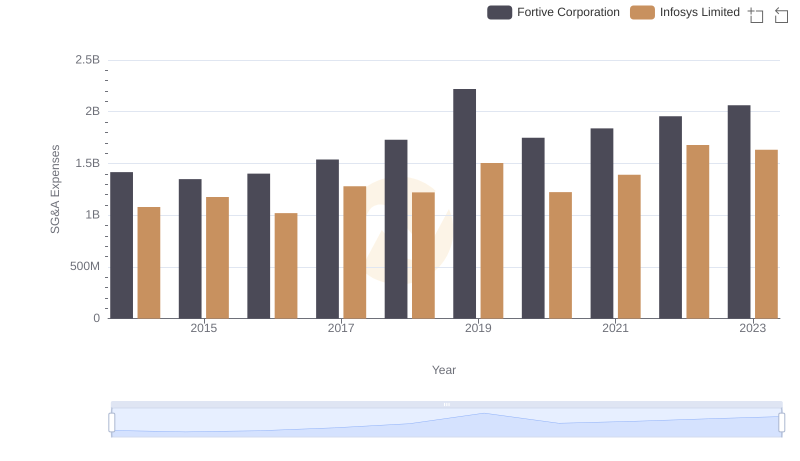
Infosys Limited vs Fortive Corporation: SG&A Expense Trends
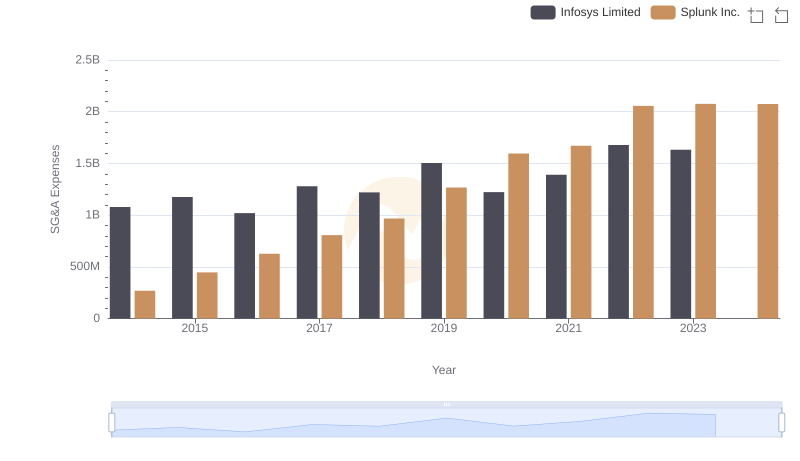
Infosys Limited vs Splunk Inc.: SG&A Expense Trends
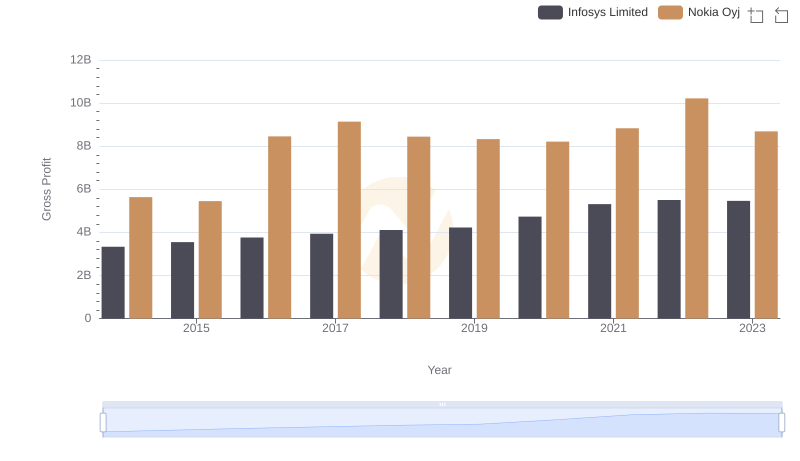
Key Insights on Gross Profit: Infosys Limited vs Nokia Oyj
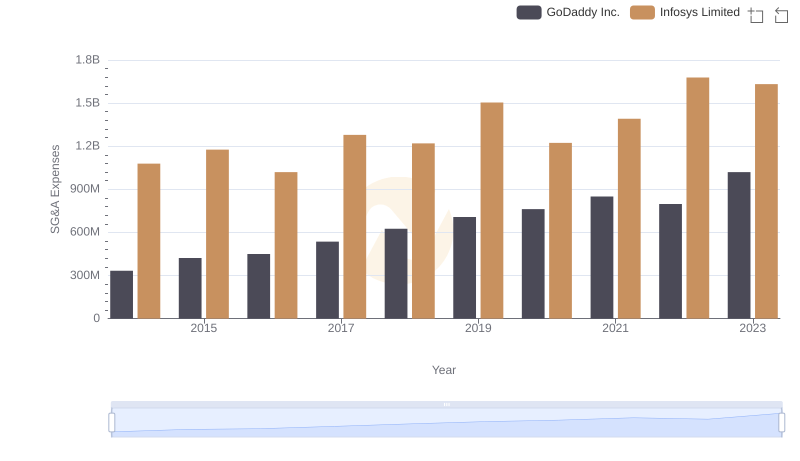
Selling, General, and Administrative Costs: Infosys Limited vs GoDaddy Inc.
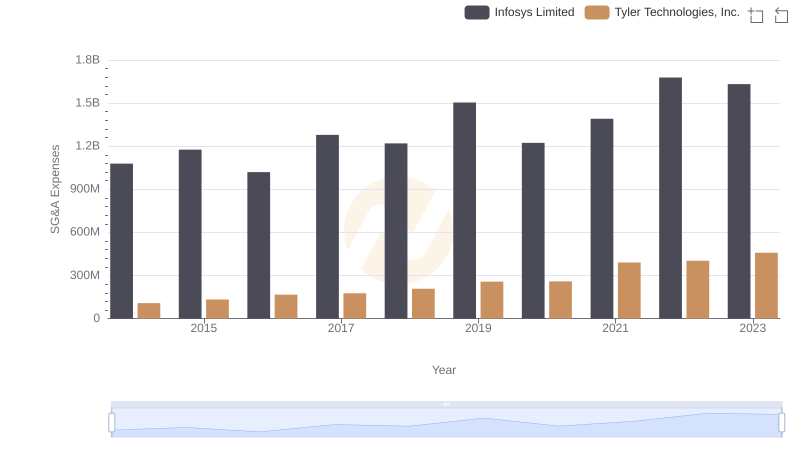
Selling, General, and Administrative Costs: Infosys Limited vs Tyler Technologies, Inc.
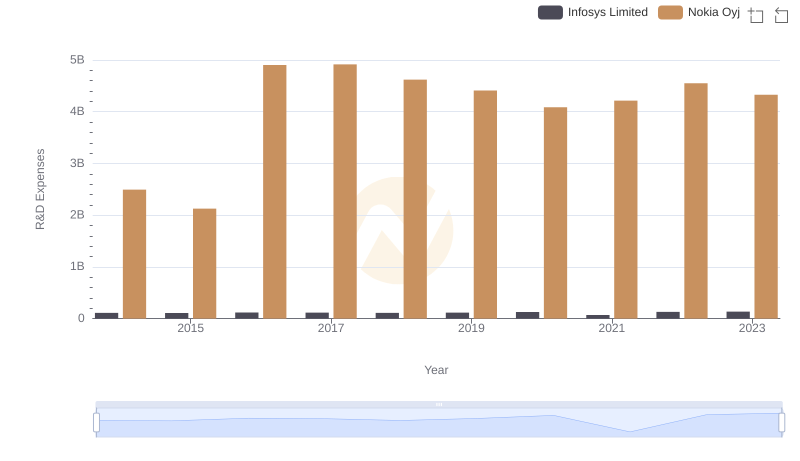
R&D Spending Showdown: Infosys Limited vs Nokia Oyj
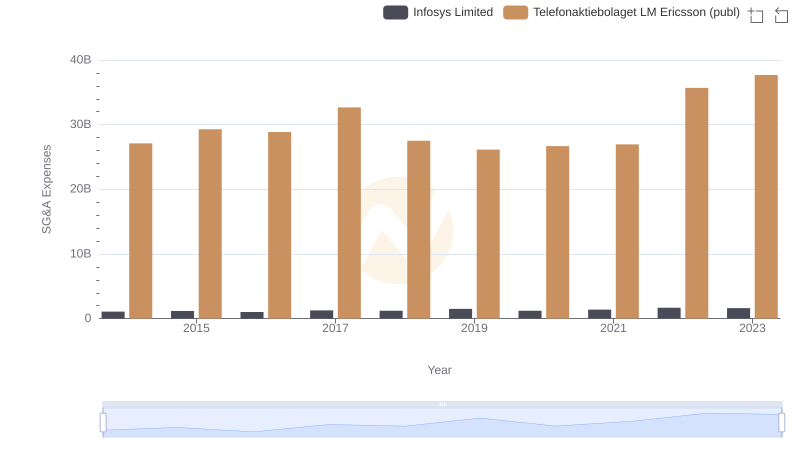
Infosys Limited or Telefonaktiebolaget LM Ericsson (publ): Who Manages SG&A Costs Better?
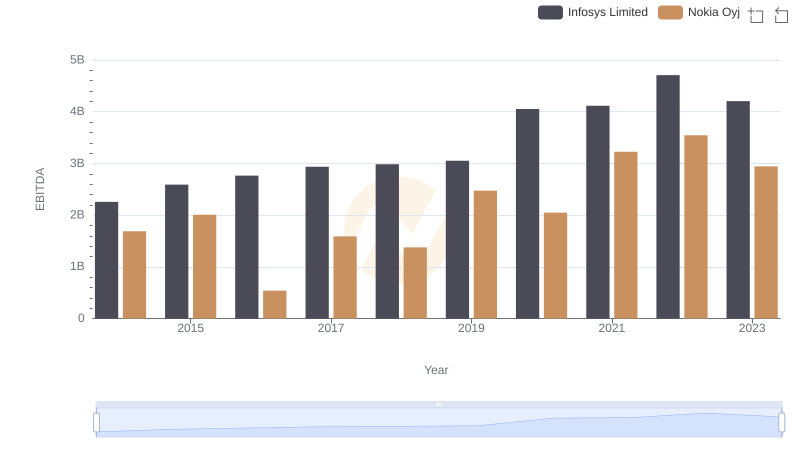
Infosys Limited vs Nokia Oyj: In-Depth EBITDA Performance Comparison
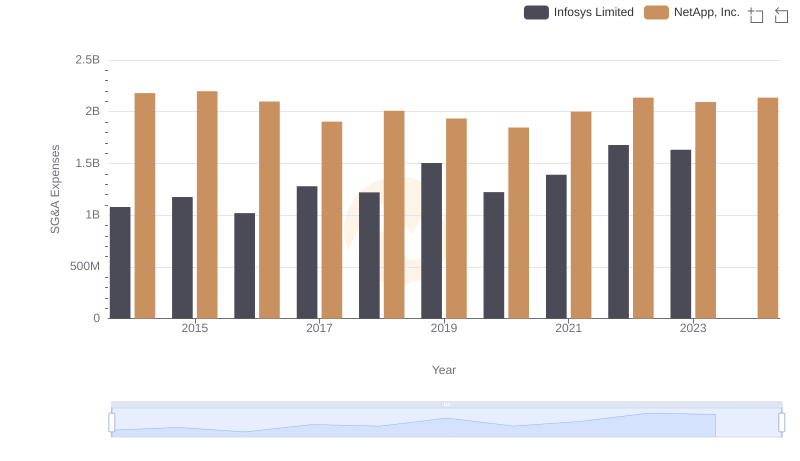
Who Optimizes SG&A Costs Better? Infosys Limited or NetApp, Inc.
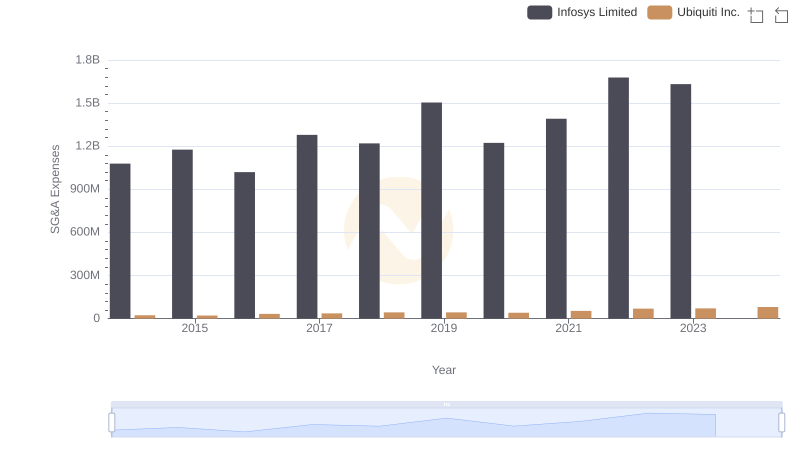
Operational Costs Compared: SG&A Analysis of Infosys Limited and Ubiquiti Inc.