| __timestamp | Infosys Limited | NetApp, Inc. |
|---|---|---|
| Wednesday, January 1, 2014 | 2258000000 | 1110900000 |
| Thursday, January 1, 2015 | 2590000000 | 1023700000 |
| Friday, January 1, 2016 | 2765000000 | 662000000 |
| Sunday, January 1, 2017 | 2936000000 | 943000000 |
| Monday, January 1, 2018 | 2984000000 | 1459000000 |
| Tuesday, January 1, 2019 | 3053000000 | 1523000000 |
| Wednesday, January 1, 2020 | 4053342784 | 1243000000 |
| Friday, January 1, 2021 | 4116000000 | 1295000000 |
| Saturday, January 1, 2022 | 4707334610 | 1364000000 |
| Sunday, January 1, 2023 | 4206000000 | 1434000000 |
| Monday, January 1, 2024 | 1582000000 |
Cracking the code
In the ever-evolving landscape of global technology, the financial performance of industry giants like Infosys Limited and NetApp, Inc. offers a fascinating glimpse into their strategic prowess. Over the past decade, Infosys has demonstrated a robust growth trajectory, with its EBITDA increasing by approximately 86% from 2014 to 2023. This growth underscores Infosys's ability to adapt and thrive in a competitive market.
Conversely, NetApp, Inc. has shown a steady, albeit slower, growth pattern, with its EBITDA rising by around 29% over the same period. This indicates a more conservative approach, focusing on sustainable growth.
Interestingly, the data for 2024 reveals a missing value for Infosys, suggesting potential challenges or strategic shifts. Meanwhile, NetApp's EBITDA continues to rise, reaching its highest point in the dataset. This comparison highlights the dynamic nature of the tech industry and the diverse strategies employed by leading companies.
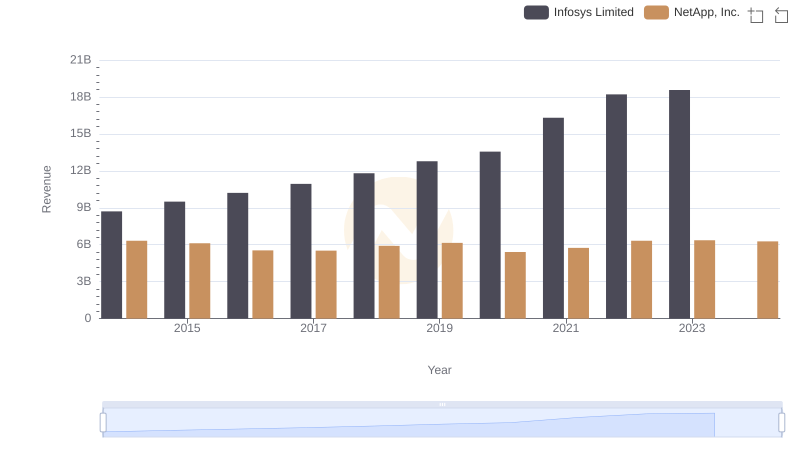
Annual Revenue Comparison: Infosys Limited vs NetApp, Inc.
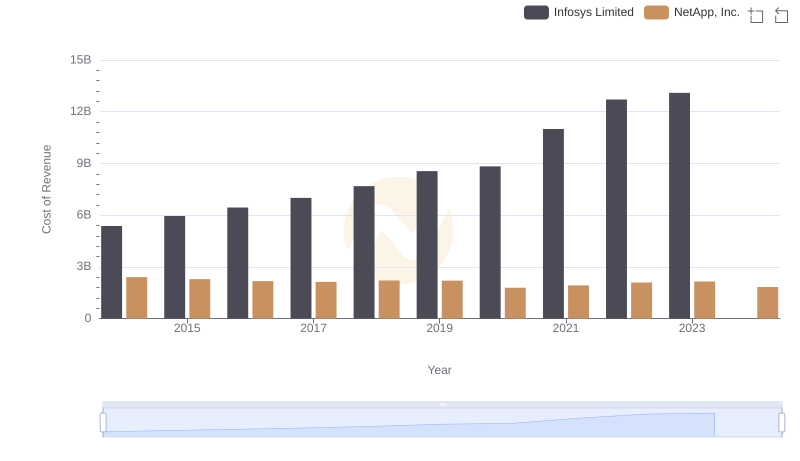
Cost of Revenue Comparison: Infosys Limited vs NetApp, Inc.
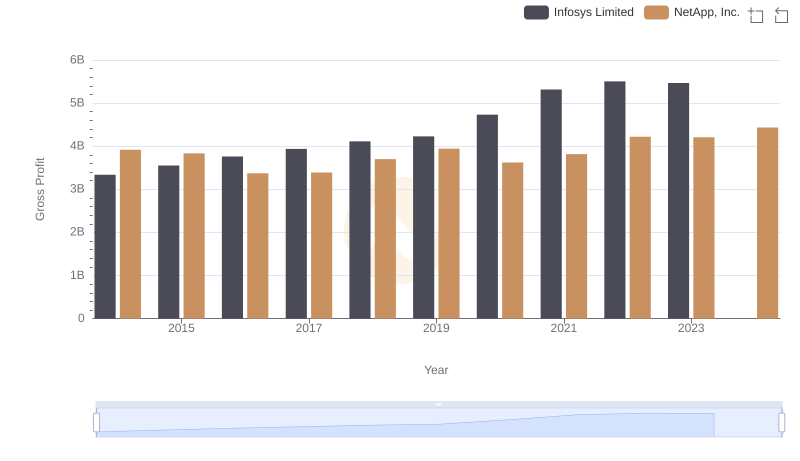
Gross Profit Analysis: Comparing Infosys Limited and NetApp, Inc.
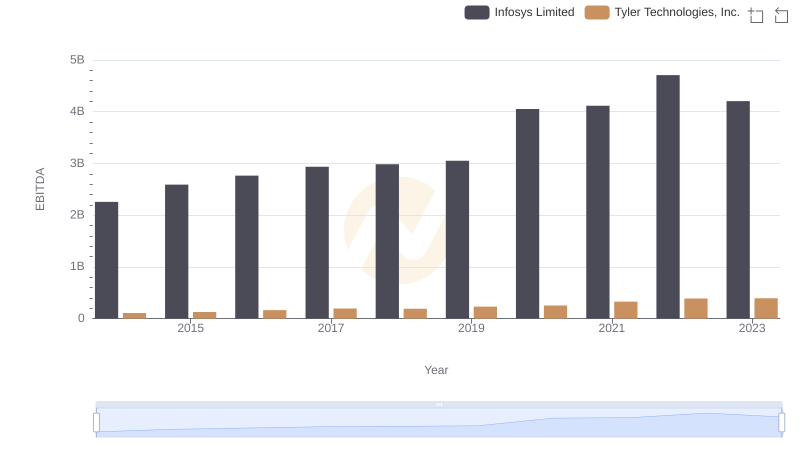
Comprehensive EBITDA Comparison: Infosys Limited vs Tyler Technologies, Inc.
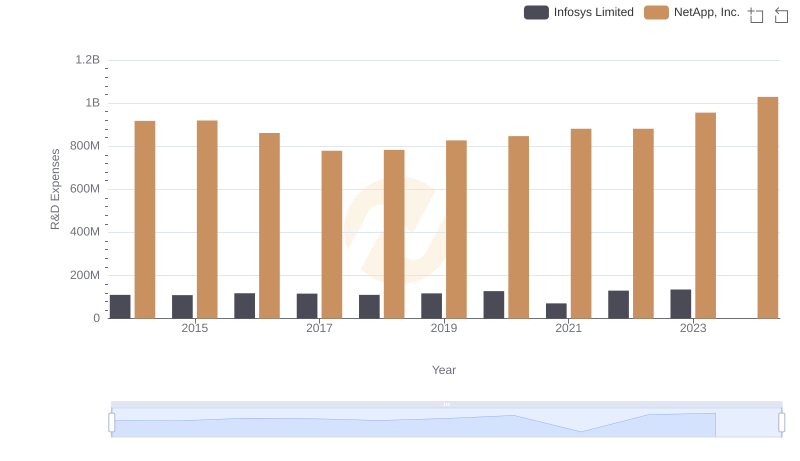
Analyzing R&D Budgets: Infosys Limited vs NetApp, Inc.
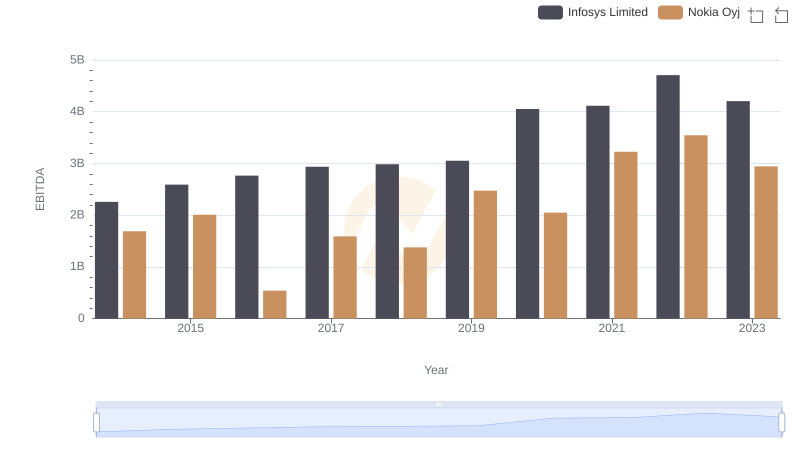
Infosys Limited vs Nokia Oyj: In-Depth EBITDA Performance Comparison
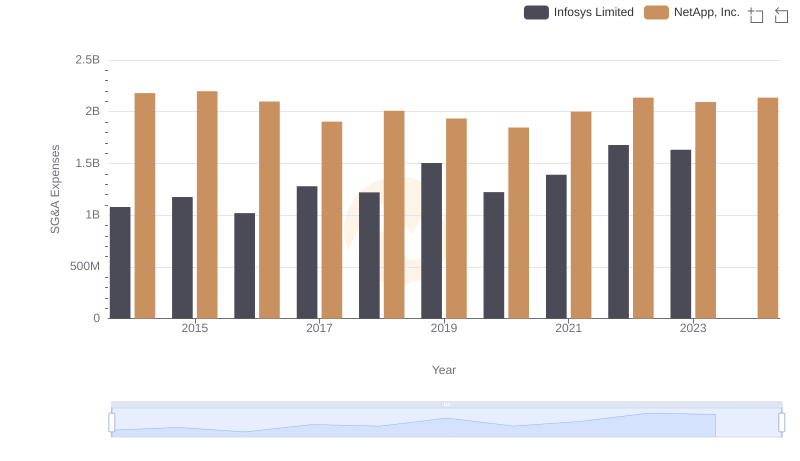
Who Optimizes SG&A Costs Better? Infosys Limited or NetApp, Inc.
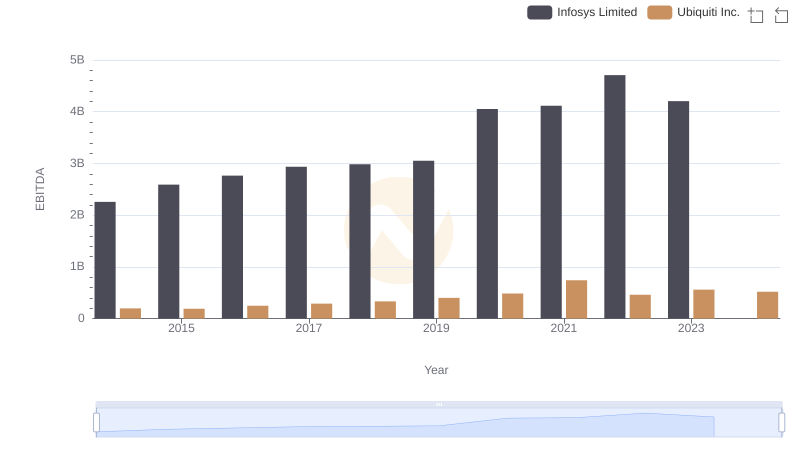
A Professional Review of EBITDA: Infosys Limited Compared to Ubiquiti Inc.
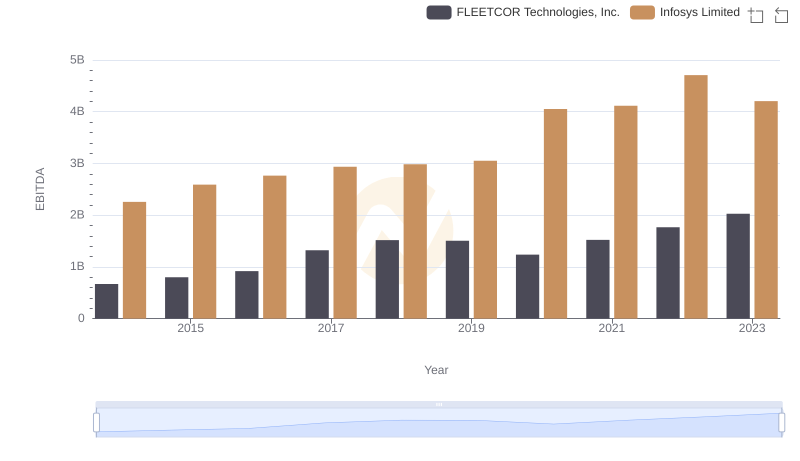
Infosys Limited and FLEETCOR Technologies, Inc.: A Detailed Examination of EBITDA Performance
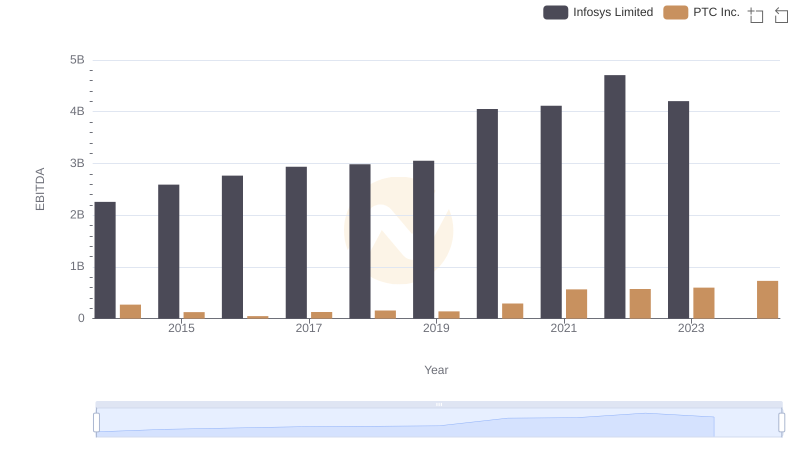
A Side-by-Side Analysis of EBITDA: Infosys Limited and PTC Inc.

A Professional Review of EBITDA: Infosys Limited Compared to ON Semiconductor Corporation
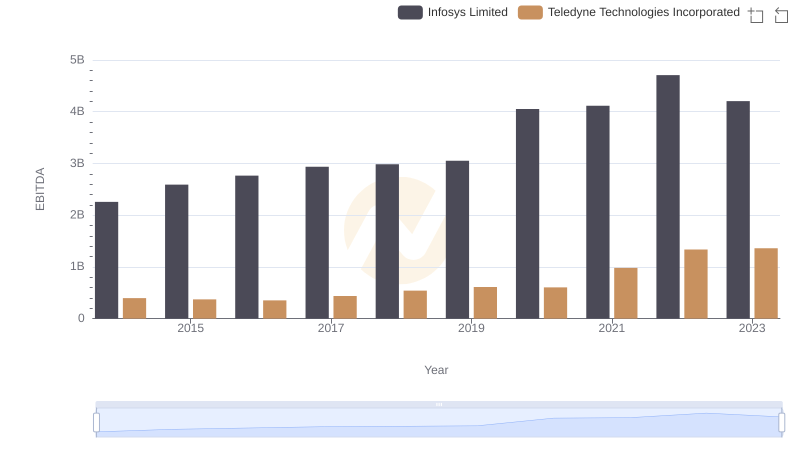
EBITDA Performance Review: Infosys Limited vs Teledyne Technologies Incorporated