| __timestamp | Hewlett Packard Enterprise Company | Infosys Limited |
|---|---|---|
| Wednesday, January 1, 2014 | 7961000000 | 2258000000 |
| Thursday, January 1, 2015 | 6964000000 | 2590000000 |
| Friday, January 1, 2016 | 7933000000 | 2765000000 |
| Sunday, January 1, 2017 | 3820000000 | 2936000000 |
| Monday, January 1, 2018 | 3709000000 | 2984000000 |
| Tuesday, January 1, 2019 | 5459000000 | 3053000000 |
| Wednesday, January 1, 2020 | 4263000000 | 4053342784 |
| Friday, January 1, 2021 | 4853000000 | 4116000000 |
| Saturday, January 1, 2022 | 4779000000 | 4707334610 |
| Sunday, January 1, 2023 | 5058000000 | 4206000000 |
| Monday, January 1, 2024 | 5024000000 |
Infusing magic into the data realm
In the ever-evolving landscape of global technology, the financial performance of industry giants like Infosys Limited and Hewlett Packard Enterprise (HPE) offers valuable insights. Over the past decade, HPE has consistently outperformed Infosys in terms of EBITDA, with a peak in 2014 where it was approximately 3.5 times higher than Infosys. However, the gap has narrowed significantly, with Infosys showing a robust growth trajectory, especially from 2019 onwards, where its EBITDA increased by nearly 54% by 2022. Meanwhile, HPE experienced a decline of around 40% from its 2014 peak to 2018, before stabilizing. This trend highlights Infosys's resilience and strategic growth in a competitive market. Notably, the data for 2024 is incomplete, indicating a need for further analysis to understand future trends.
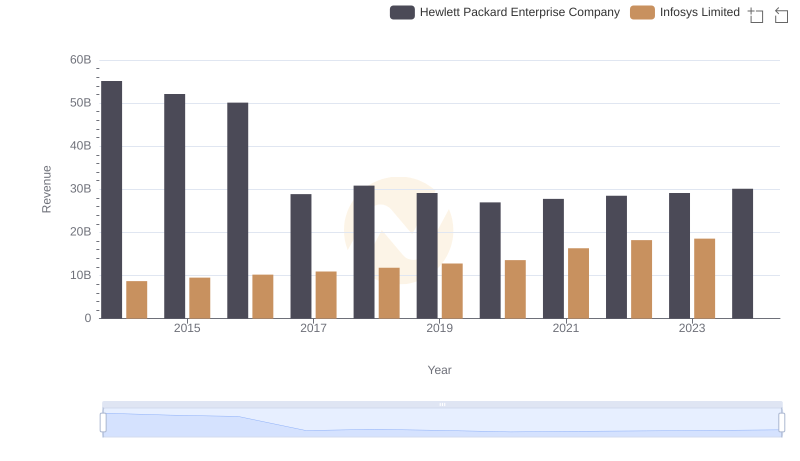
Comparing Revenue Performance: Infosys Limited or Hewlett Packard Enterprise Company?
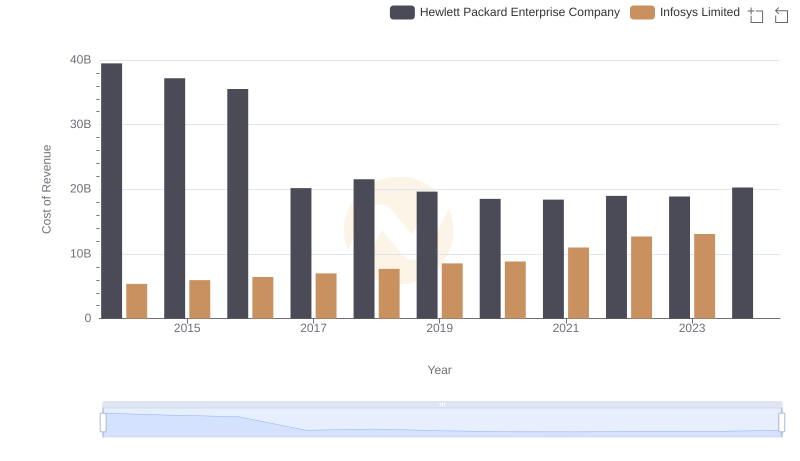
Cost of Revenue Comparison: Infosys Limited vs Hewlett Packard Enterprise Company
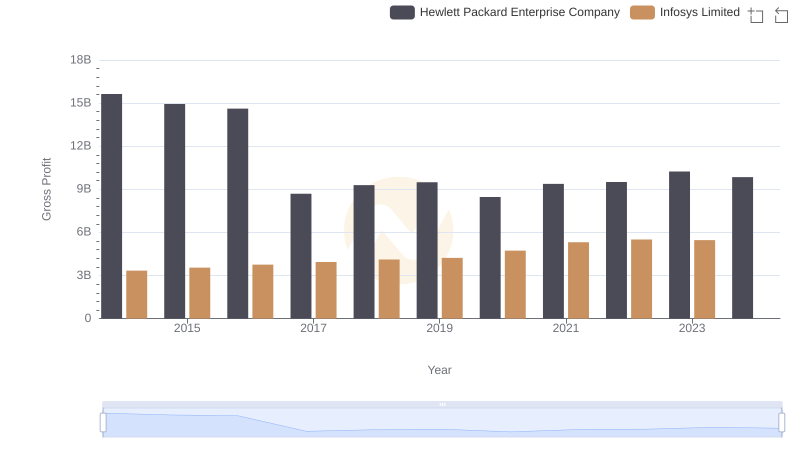
Gross Profit Trends Compared: Infosys Limited vs Hewlett Packard Enterprise Company
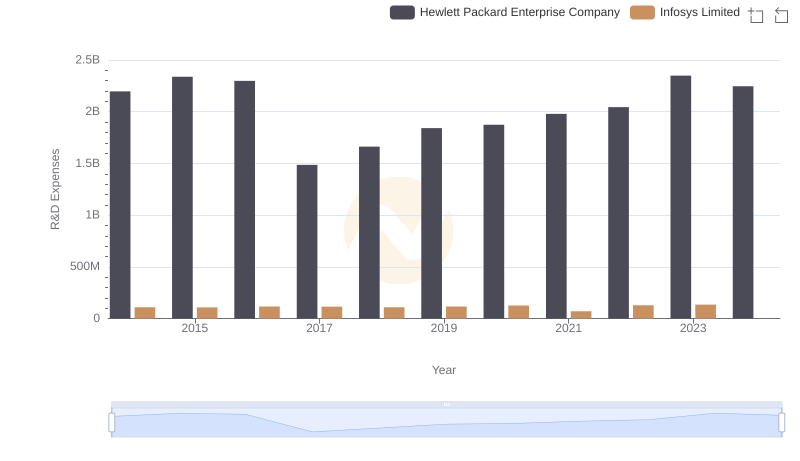
Infosys Limited vs Hewlett Packard Enterprise Company: Strategic Focus on R&D Spending
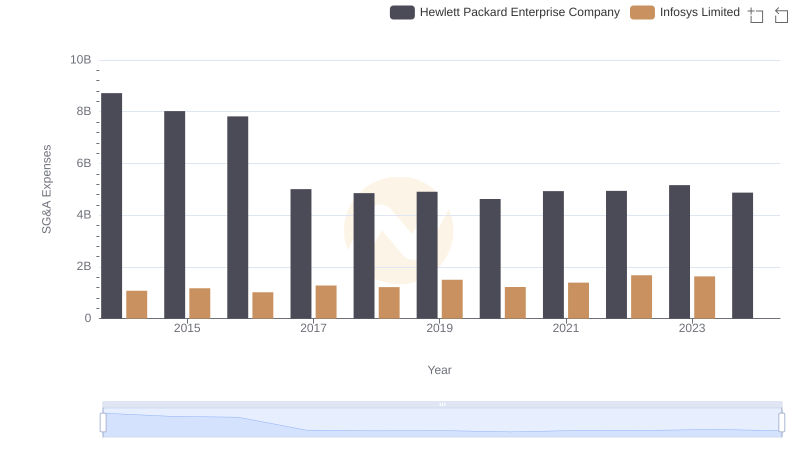
Who Optimizes SG&A Costs Better? Infosys Limited or Hewlett Packard Enterprise Company
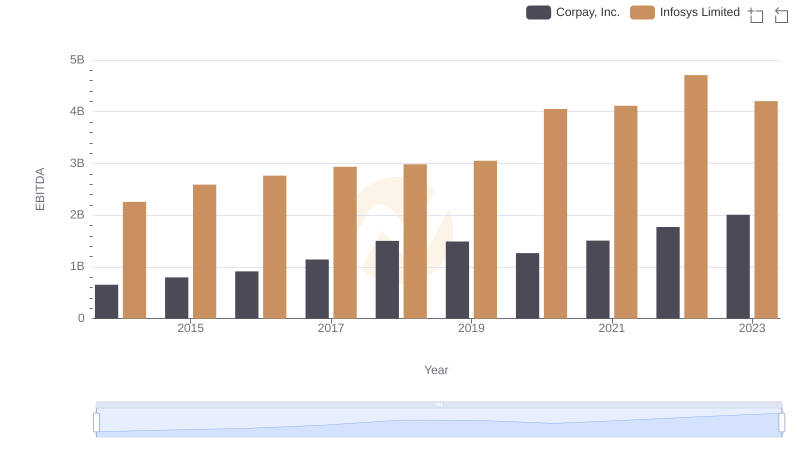
Infosys Limited and Corpay, Inc.: A Detailed Examination of EBITDA Performance
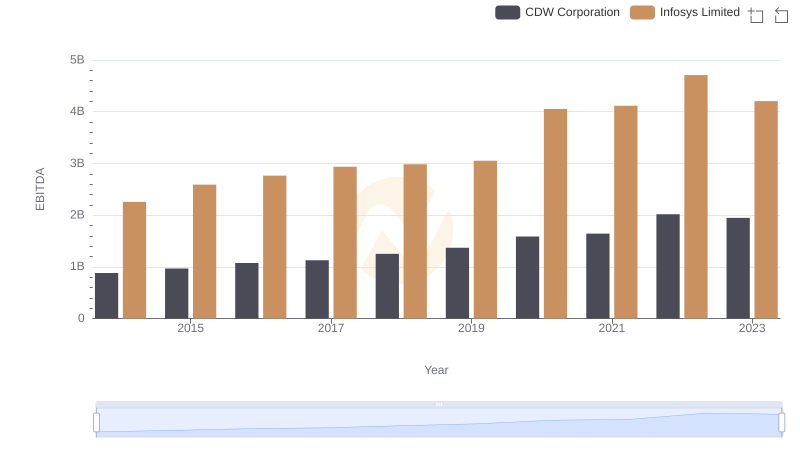
EBITDA Performance Review: Infosys Limited vs CDW Corporation
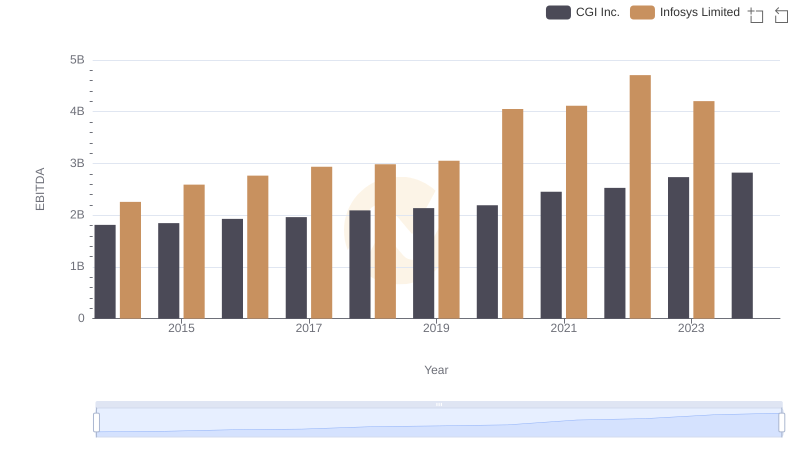
A Professional Review of EBITDA: Infosys Limited Compared to CGI Inc.
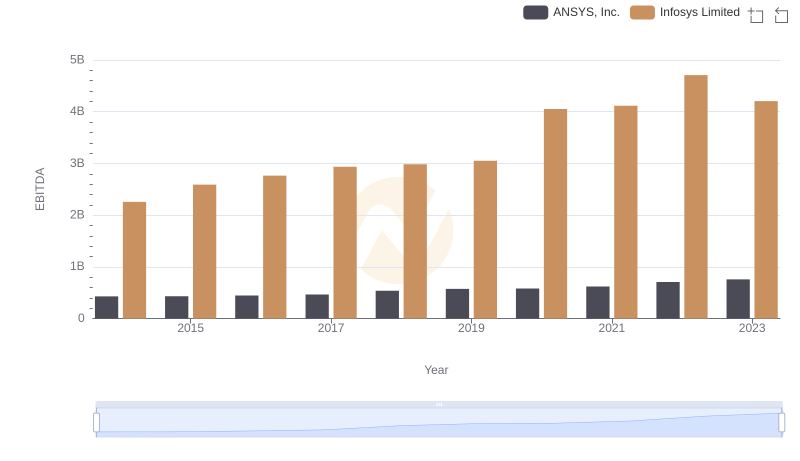
EBITDA Performance Review: Infosys Limited vs ANSYS, Inc.
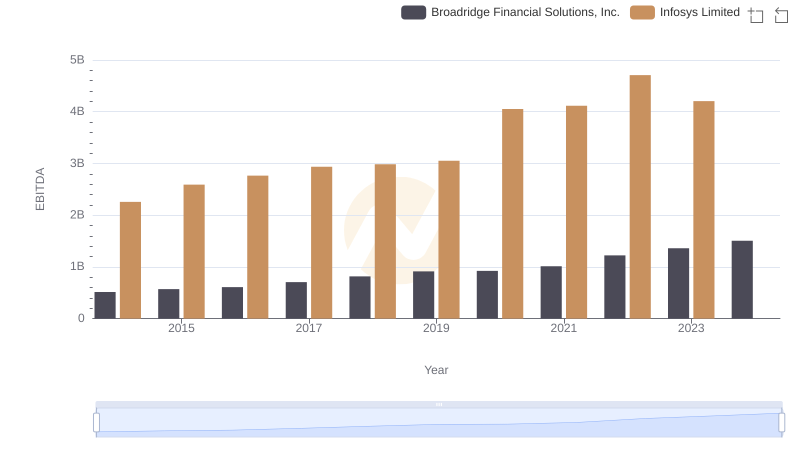
Infosys Limited and Broadridge Financial Solutions, Inc.: A Detailed Examination of EBITDA Performance
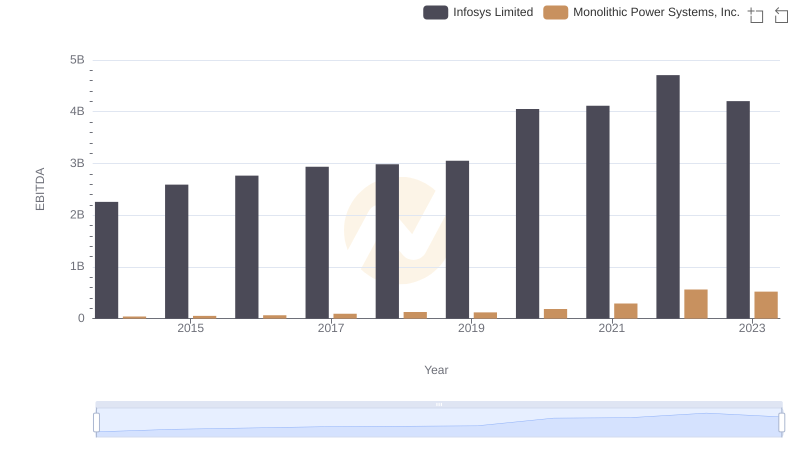
Comparative EBITDA Analysis: Infosys Limited vs Monolithic Power Systems, Inc.
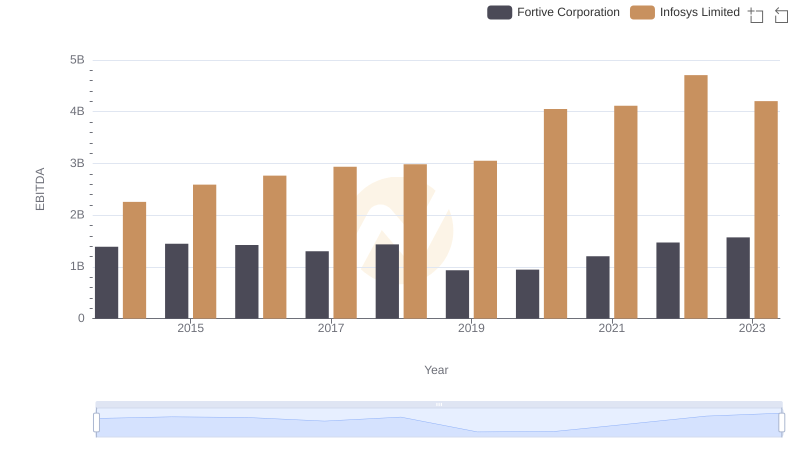
Comprehensive EBITDA Comparison: Infosys Limited vs Fortive Corporation