| __timestamp | Infosys Limited | Monolithic Power Systems, Inc. |
|---|---|---|
| Wednesday, January 1, 2014 | 2258000000 | 41003000 |
| Thursday, January 1, 2015 | 2590000000 | 53346000 |
| Friday, January 1, 2016 | 2765000000 | 65992000 |
| Sunday, January 1, 2017 | 2936000000 | 94768000 |
| Monday, January 1, 2018 | 2984000000 | 127721000 |
| Tuesday, January 1, 2019 | 3053000000 | 119893000 |
| Wednesday, January 1, 2020 | 4053342784 | 185872000 |
| Friday, January 1, 2021 | 4116000000 | 291116000 |
| Saturday, January 1, 2022 | 4707334610 | 563899000 |
| Sunday, January 1, 2023 | 4206000000 | 521904000 |
Unveiling the hidden dimensions of data
In the ever-evolving landscape of global technology, the financial performance of industry giants like Infosys Limited and Monolithic Power Systems, Inc. offers a fascinating glimpse into their strategic prowess. Over the past decade, Infosys has consistently demonstrated robust growth, with its EBITDA increasing by approximately 86% from 2014 to 2023. This growth trajectory underscores Infosys's ability to adapt and thrive in a competitive market.
Conversely, Monolithic Power Systems, Inc. has shown a remarkable surge, with its EBITDA skyrocketing by over 1,170% during the same period. This exponential growth highlights the company's innovative edge and its successful penetration into new markets.
While Infosys's EBITDA remains significantly higher, Monolithic Power's rapid ascent is a testament to its dynamic business model. As we look to the future, these trends offer valuable insights into the strategic directions of these tech titans.
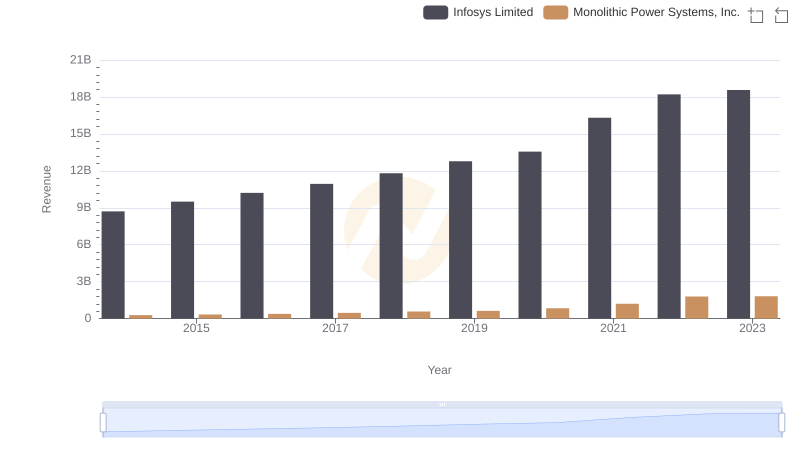
Infosys Limited vs Monolithic Power Systems, Inc.: Annual Revenue Growth Compared
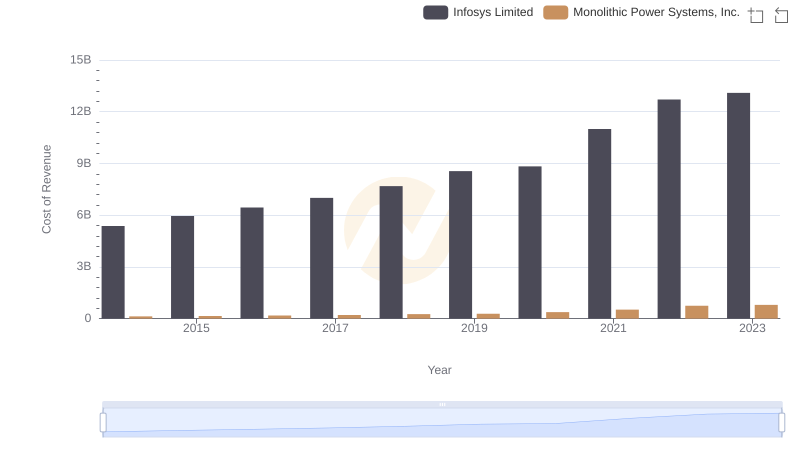
Analyzing Cost of Revenue: Infosys Limited and Monolithic Power Systems, Inc.
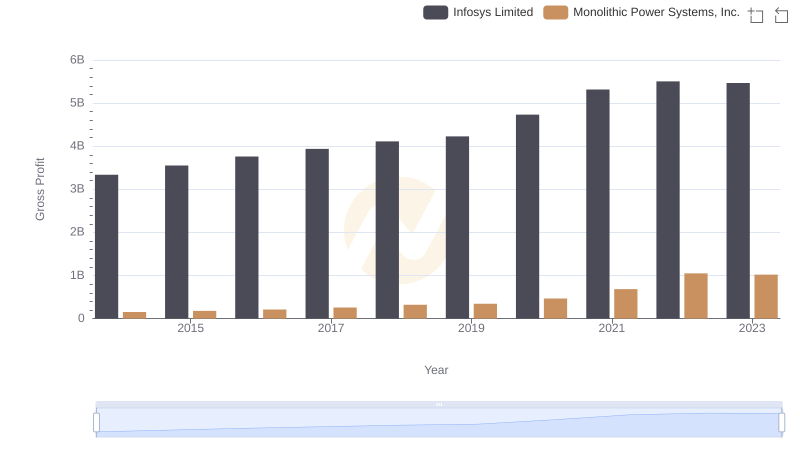
Infosys Limited and Monolithic Power Systems, Inc.: A Detailed Gross Profit Analysis
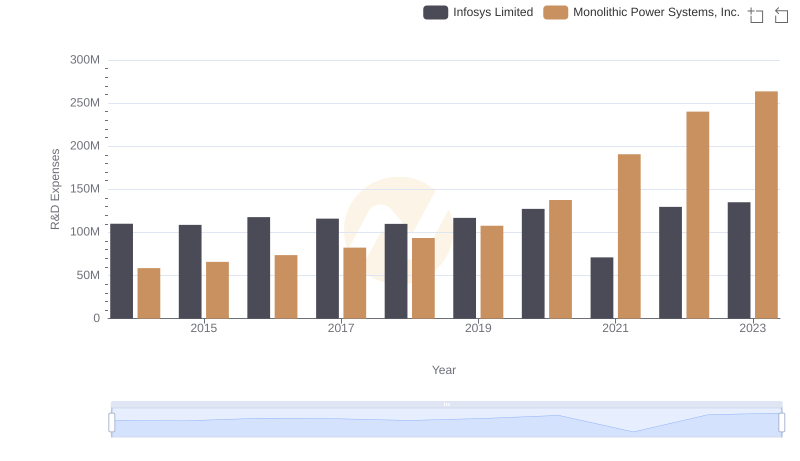
Infosys Limited or Monolithic Power Systems, Inc.: Who Invests More in Innovation?
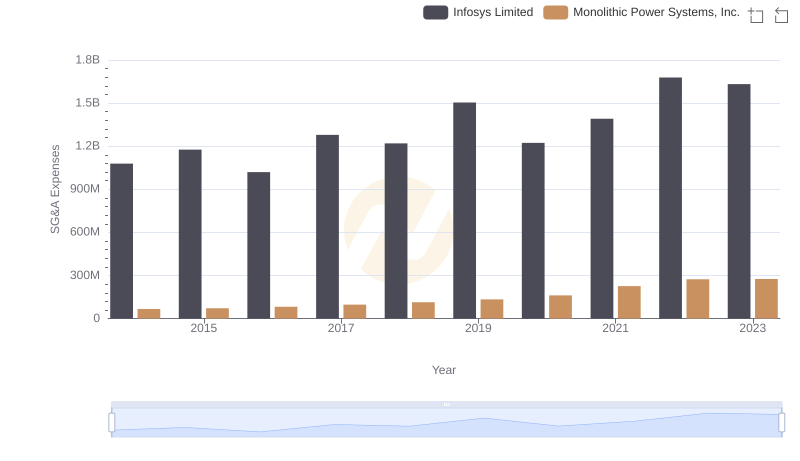
SG&A Efficiency Analysis: Comparing Infosys Limited and Monolithic Power Systems, Inc.
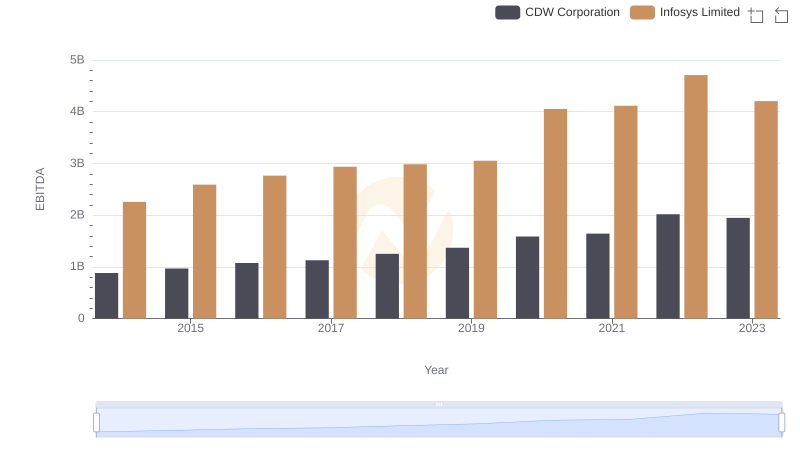
EBITDA Performance Review: Infosys Limited vs CDW Corporation
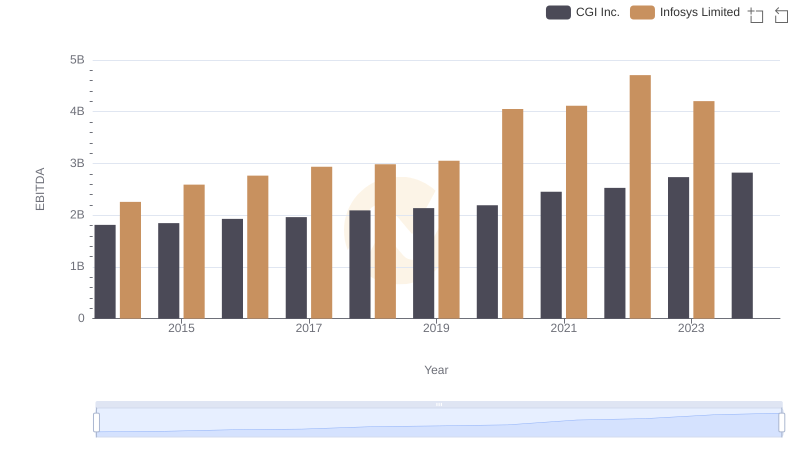
A Professional Review of EBITDA: Infosys Limited Compared to CGI Inc.
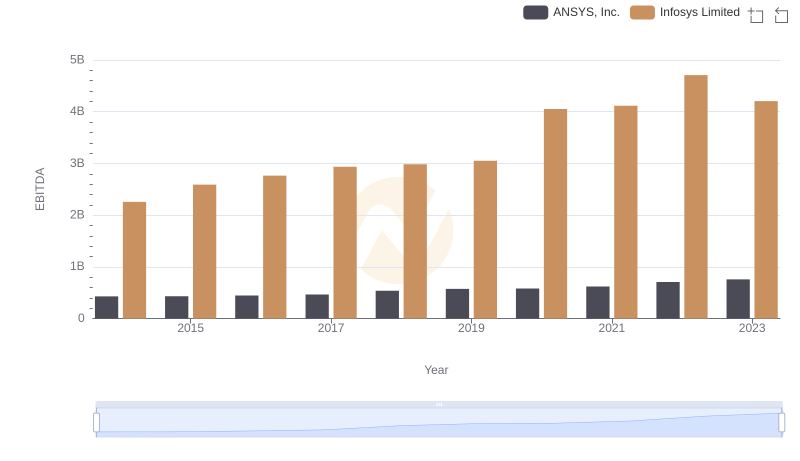
EBITDA Performance Review: Infosys Limited vs ANSYS, Inc.
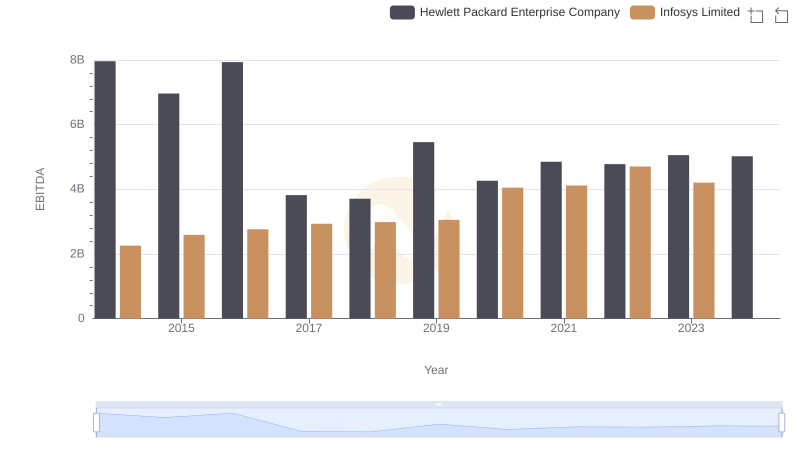
EBITDA Performance Review: Infosys Limited vs Hewlett Packard Enterprise Company
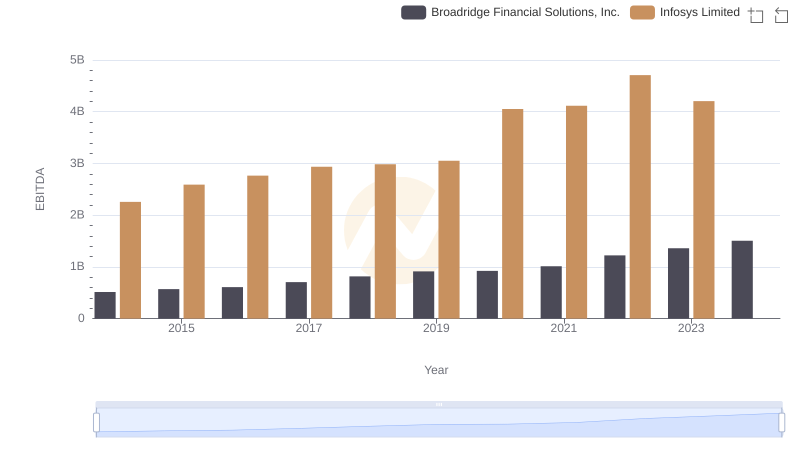
Infosys Limited and Broadridge Financial Solutions, Inc.: A Detailed Examination of EBITDA Performance
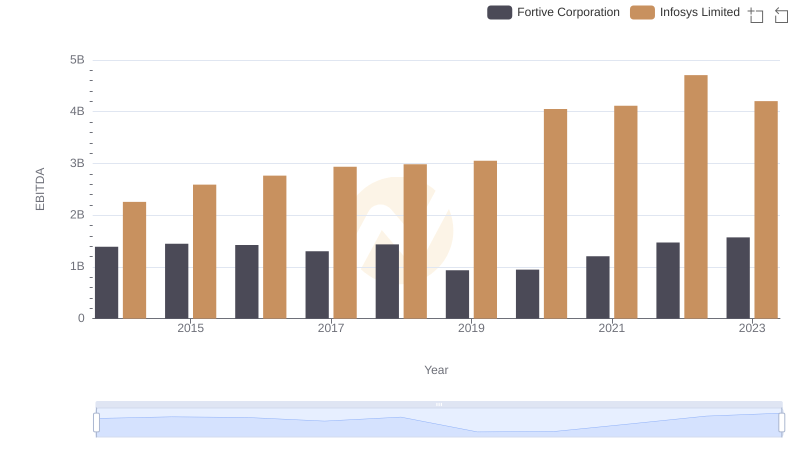
Comprehensive EBITDA Comparison: Infosys Limited vs Fortive Corporation
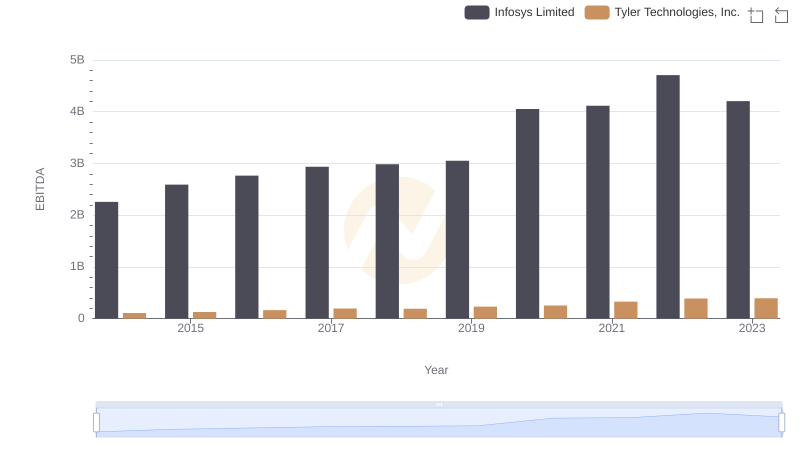
Comprehensive EBITDA Comparison: Infosys Limited vs Tyler Technologies, Inc.