| __timestamp | Infosys Limited | Tyler Technologies, Inc. |
|---|---|---|
| Wednesday, January 1, 2014 | 2258000000 | 109427000 |
| Thursday, January 1, 2015 | 2590000000 | 127617000 |
| Friday, January 1, 2016 | 2765000000 | 165194000 |
| Sunday, January 1, 2017 | 2936000000 | 194467000 |
| Monday, January 1, 2018 | 2984000000 | 191279000 |
| Tuesday, January 1, 2019 | 3053000000 | 233039000 |
| Wednesday, January 1, 2020 | 4053342784 | 254583000 |
| Friday, January 1, 2021 | 4116000000 | 328119000 |
| Saturday, January 1, 2022 | 4707334610 | 388013000 |
| Sunday, January 1, 2023 | 4206000000 | 392632000 |
| Monday, January 1, 2024 | 299526000 |
In pursuit of knowledge
In the ever-evolving landscape of global technology, Infosys Limited and Tyler Technologies, Inc. stand as titans in their respective domains. Over the past decade, Infosys has consistently demonstrated robust growth, with its EBITDA soaring by approximately 86% from 2014 to 2023. This Indian IT behemoth reached its peak in 2022, showcasing its resilience and adaptability in a competitive market.
Meanwhile, Tyler Technologies, a leader in public sector software solutions, has also shown impressive growth, albeit on a different scale. From 2014 to 2023, Tyler's EBITDA increased by a remarkable 259%, reflecting its strategic expansion and innovation in the public sector.
This comparison not only highlights the diverse strategies of these two companies but also underscores the dynamic nature of the tech industry, where adaptability and innovation are key to sustained success.
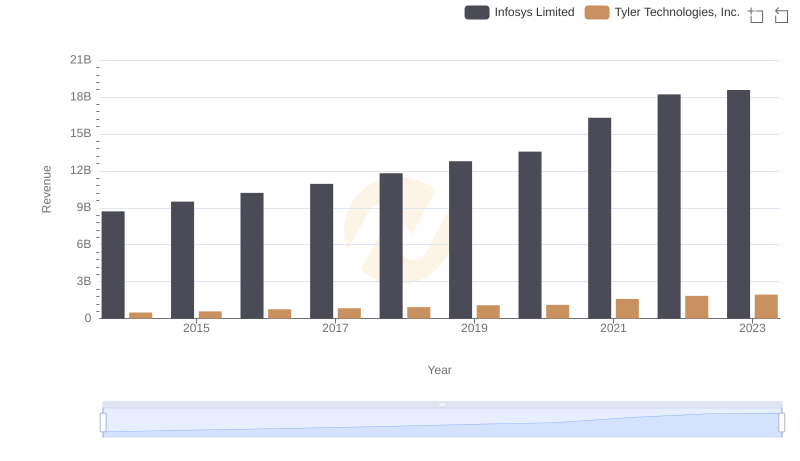
Annual Revenue Comparison: Infosys Limited vs Tyler Technologies, Inc.
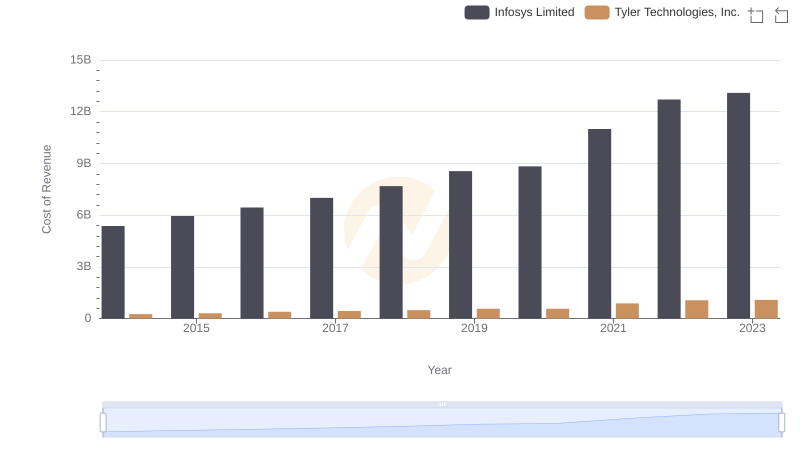
Cost of Revenue: Key Insights for Infosys Limited and Tyler Technologies, Inc.
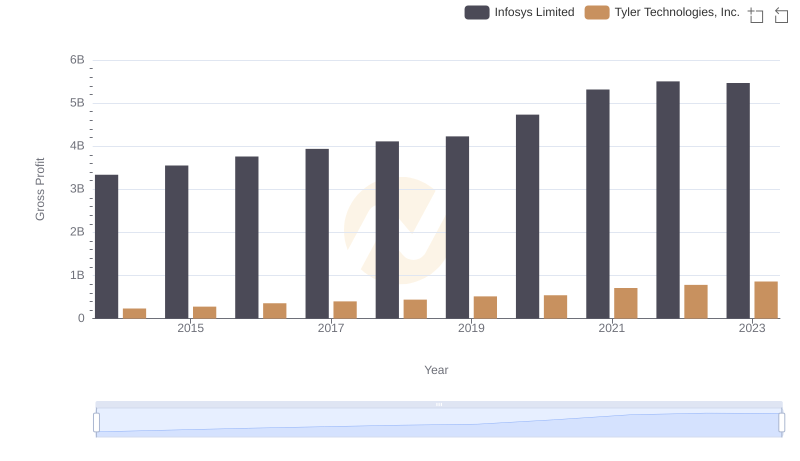
Gross Profit Trends Compared: Infosys Limited vs Tyler Technologies, Inc.
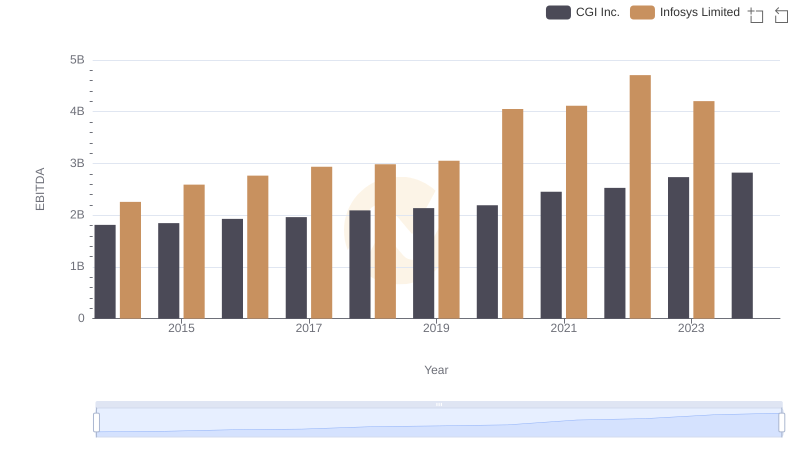
A Professional Review of EBITDA: Infosys Limited Compared to CGI Inc.
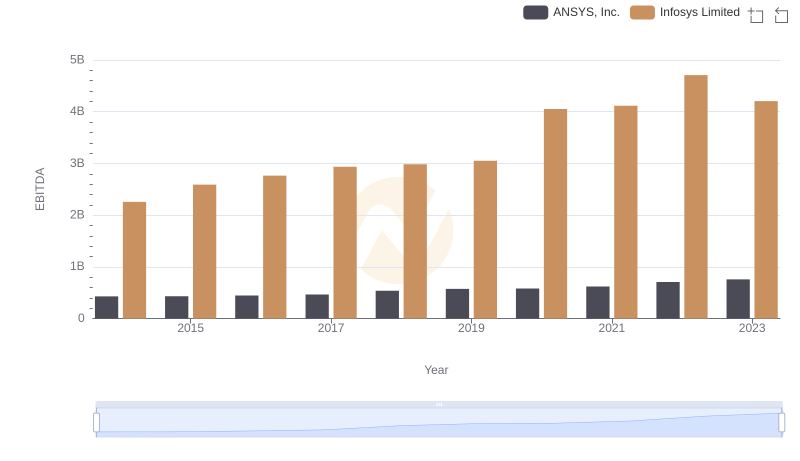
EBITDA Performance Review: Infosys Limited vs ANSYS, Inc.
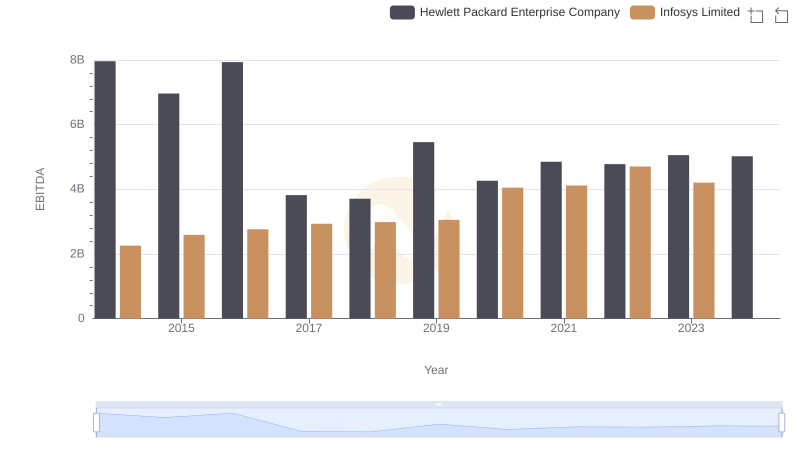
EBITDA Performance Review: Infosys Limited vs Hewlett Packard Enterprise Company
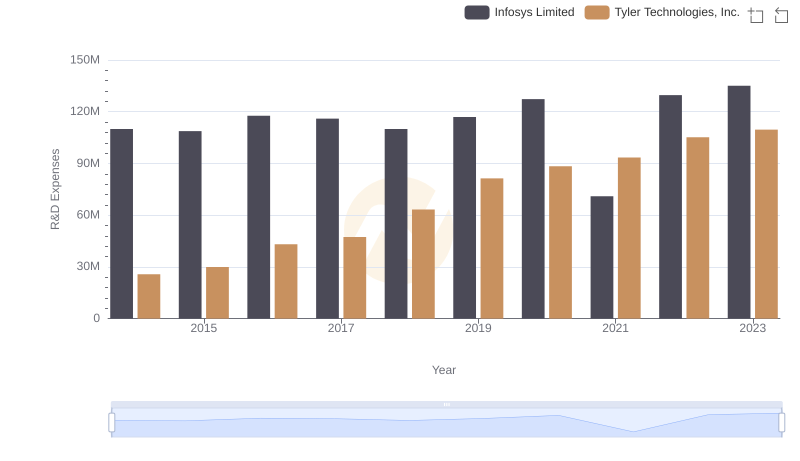
Research and Development: Comparing Key Metrics for Infosys Limited and Tyler Technologies, Inc.
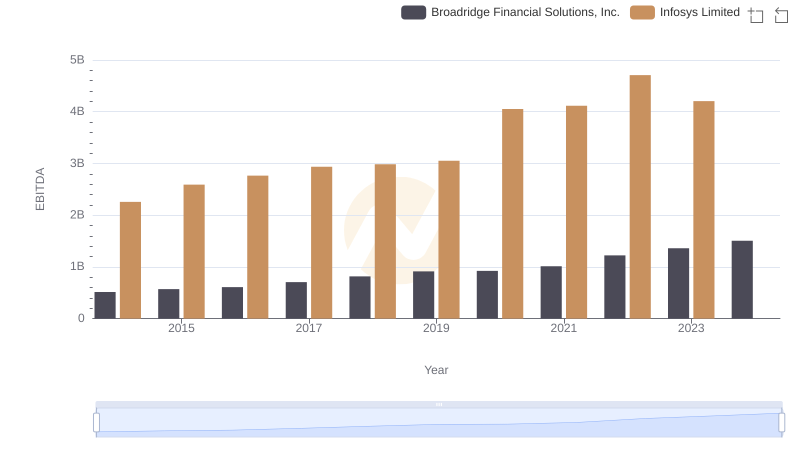
Infosys Limited and Broadridge Financial Solutions, Inc.: A Detailed Examination of EBITDA Performance
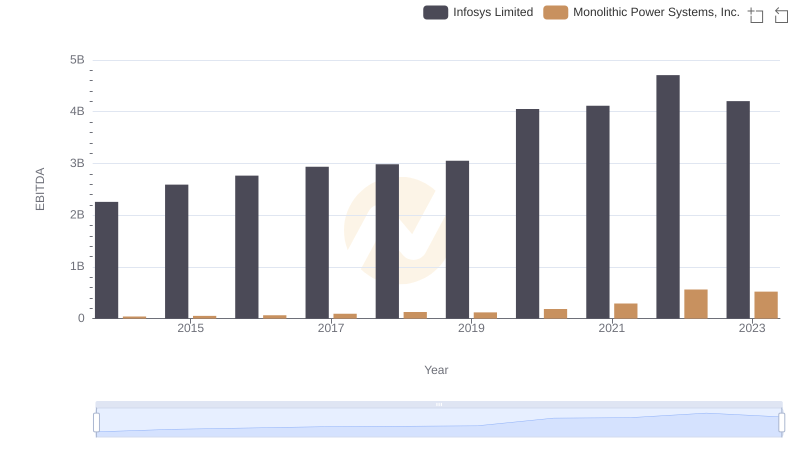
Comparative EBITDA Analysis: Infosys Limited vs Monolithic Power Systems, Inc.
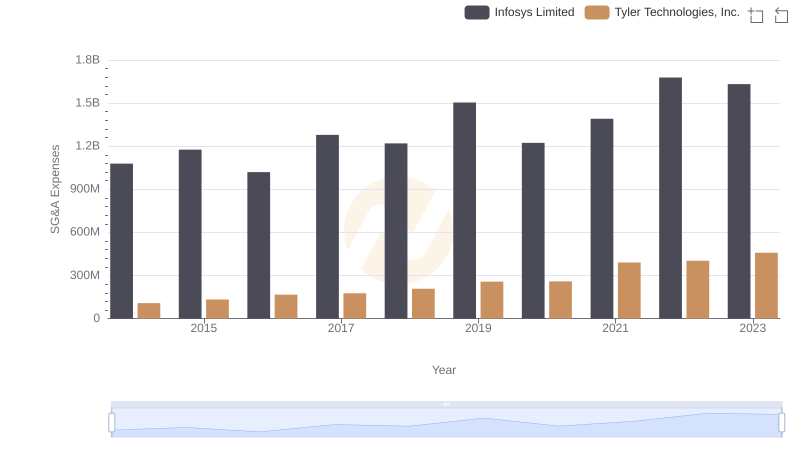
Selling, General, and Administrative Costs: Infosys Limited vs Tyler Technologies, Inc.
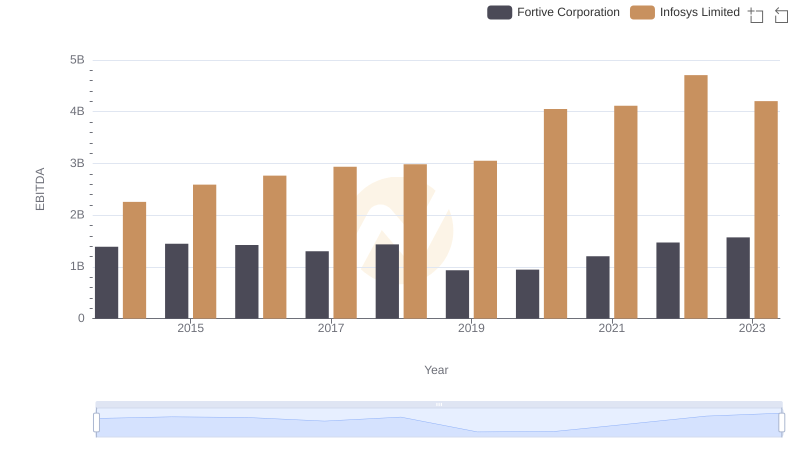
Comprehensive EBITDA Comparison: Infosys Limited vs Fortive Corporation
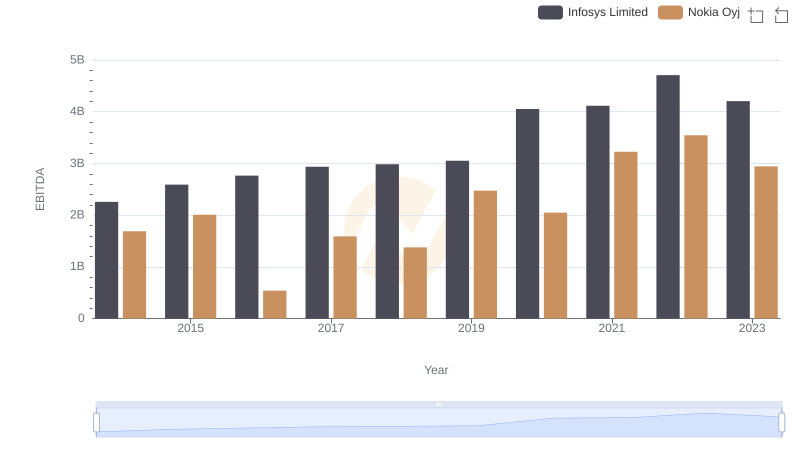
Infosys Limited vs Nokia Oyj: In-Depth EBITDA Performance Comparison