| __timestamp | Fortive Corporation | Infosys Limited |
|---|---|---|
| Wednesday, January 1, 2014 | 1389400000 | 2258000000 |
| Thursday, January 1, 2015 | 1446600000 | 2590000000 |
| Friday, January 1, 2016 | 1422400000 | 2765000000 |
| Sunday, January 1, 2017 | 1301300000 | 2936000000 |
| Monday, January 1, 2018 | 1436200000 | 2984000000 |
| Tuesday, January 1, 2019 | 936100000 | 3053000000 |
| Wednesday, January 1, 2020 | 947800000 | 4053342784 |
| Friday, January 1, 2021 | 1206100000 | 4116000000 |
| Saturday, January 1, 2022 | 1471300000 | 4707334610 |
| Sunday, January 1, 2023 | 1571100000 | 4206000000 |
| Monday, January 1, 2024 | 1206600000 |
Unveiling the hidden dimensions of data
In the ever-evolving landscape of global business, the financial health of companies is often gauged by their EBITDA, a key indicator of operational performance. Over the past decade, Infosys Limited and Fortive Corporation have showcased contrasting trajectories in their EBITDA growth.
From 2014 to 2023, Infosys has consistently outperformed Fortive, with an average EBITDA that is approximately 2.5 times higher. Notably, Infosys saw a remarkable surge in 2020, with a 33% increase from the previous year, reaching its peak in 2022. Meanwhile, Fortive's EBITDA experienced fluctuations, with a notable dip in 2019, but rebounded strongly by 2023, achieving a 68% increase from its lowest point in 2019.
This comparison not only highlights the resilience and strategic prowess of Infosys but also underscores Fortive's ability to recover and adapt in a competitive market. As we look to the future, these trends offer valuable insights for investors and industry analysts alike.
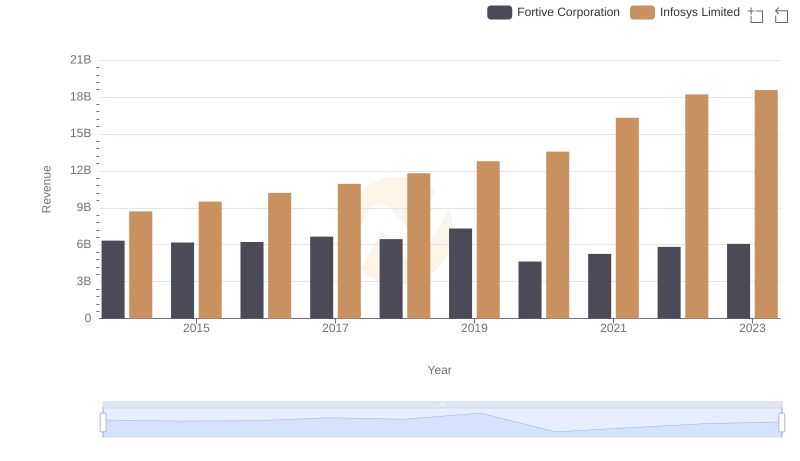
Who Generates More Revenue? Infosys Limited or Fortive Corporation
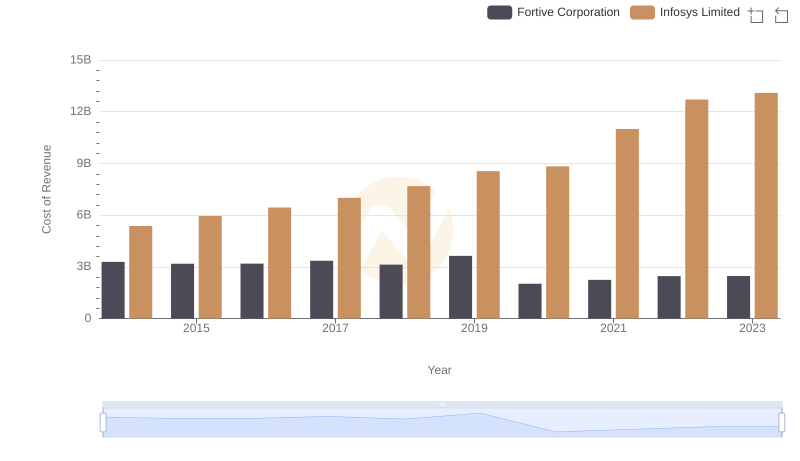
Comparing Cost of Revenue Efficiency: Infosys Limited vs Fortive Corporation
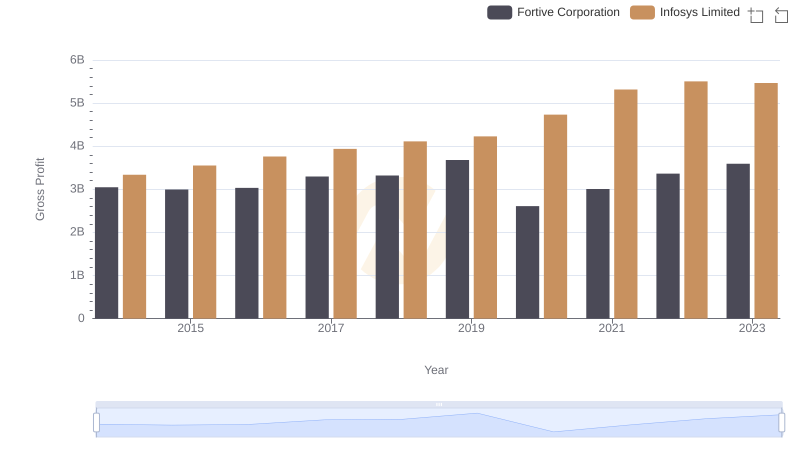
Infosys Limited and Fortive Corporation: A Detailed Gross Profit Analysis
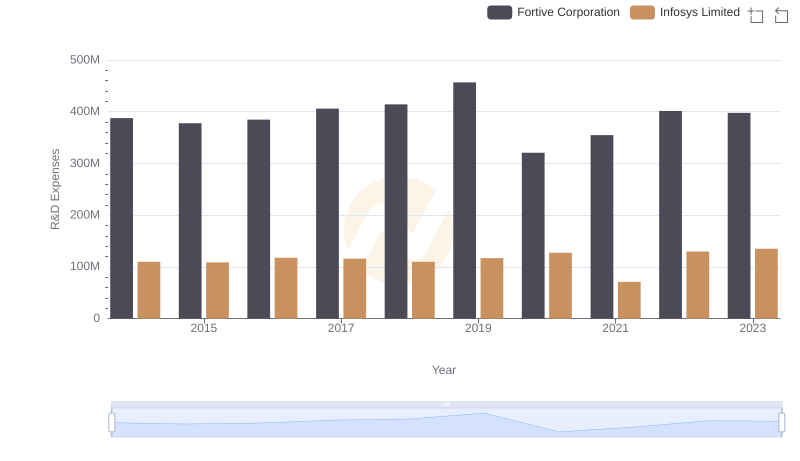
R&D Insights: How Infosys Limited and Fortive Corporation Allocate Funds
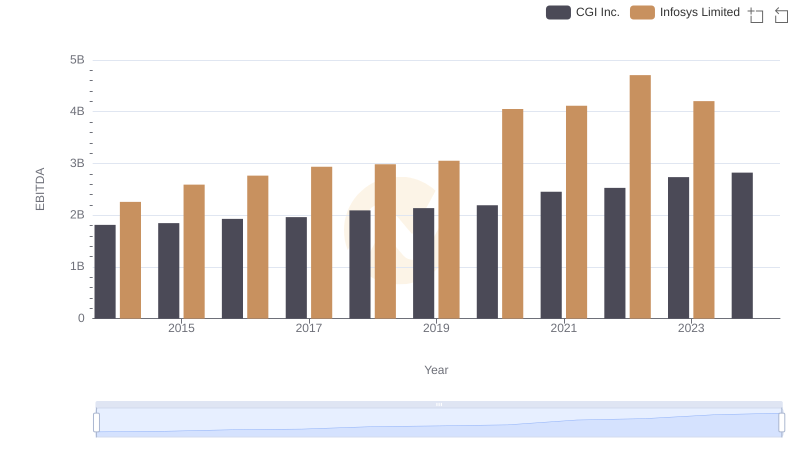
A Professional Review of EBITDA: Infosys Limited Compared to CGI Inc.
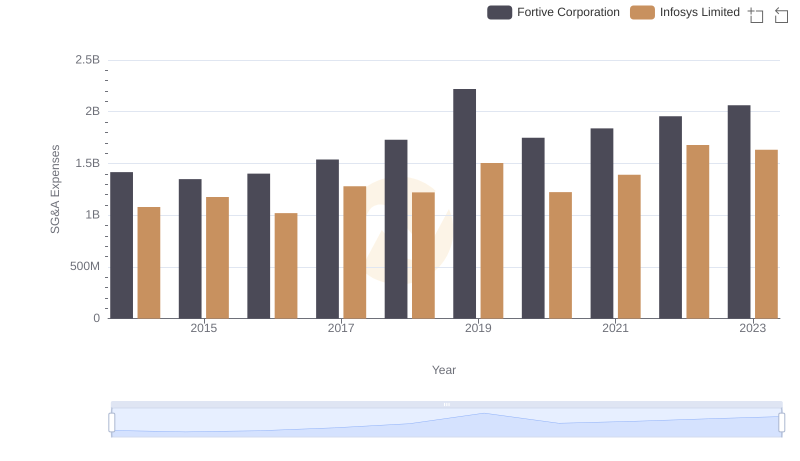
Infosys Limited vs Fortive Corporation: SG&A Expense Trends
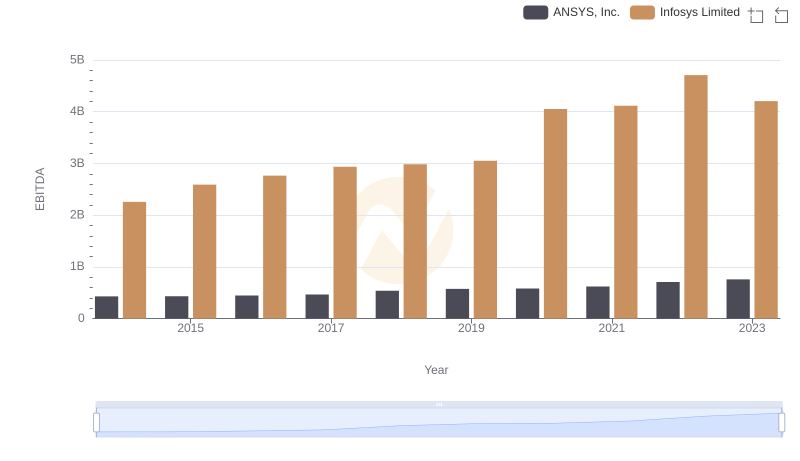
EBITDA Performance Review: Infosys Limited vs ANSYS, Inc.
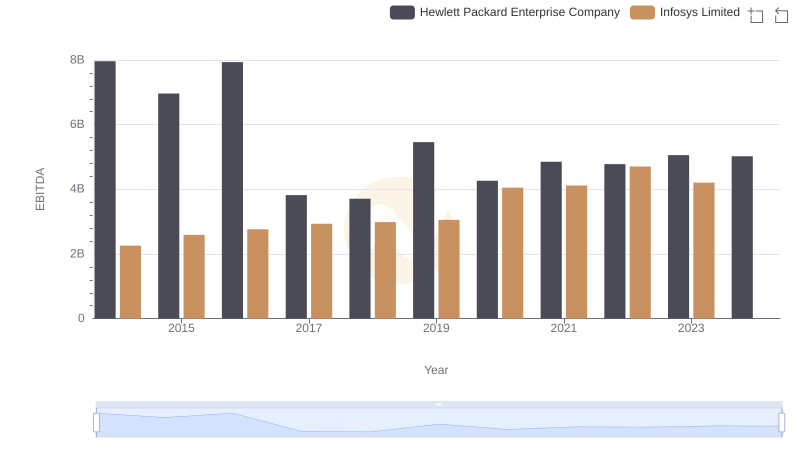
EBITDA Performance Review: Infosys Limited vs Hewlett Packard Enterprise Company
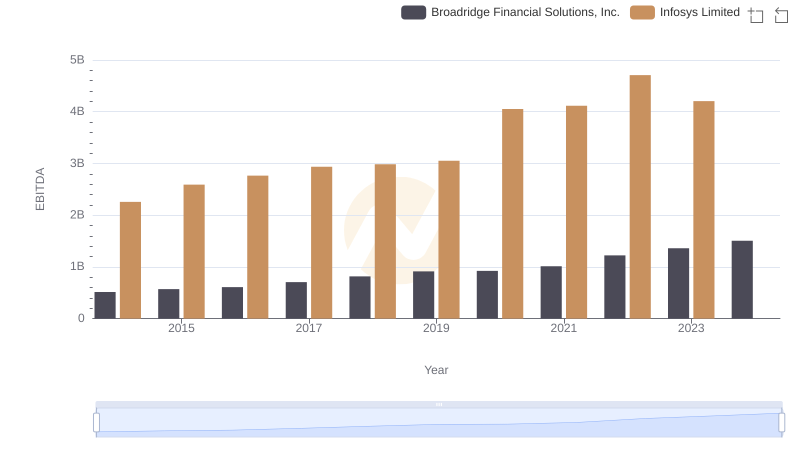
Infosys Limited and Broadridge Financial Solutions, Inc.: A Detailed Examination of EBITDA Performance
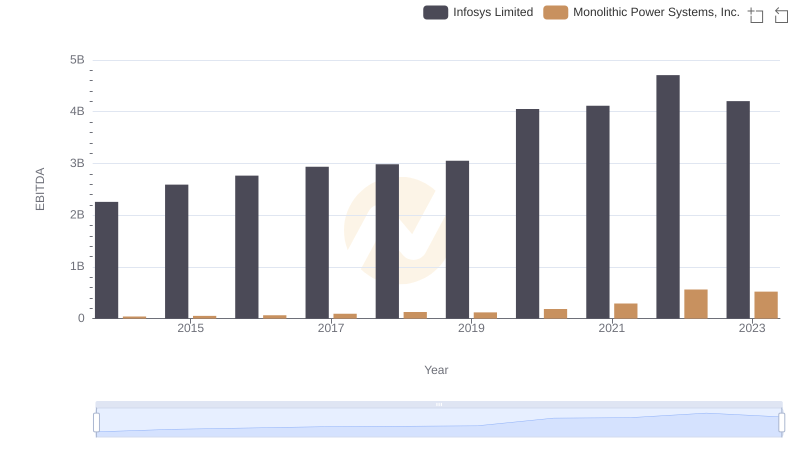
Comparative EBITDA Analysis: Infosys Limited vs Monolithic Power Systems, Inc.
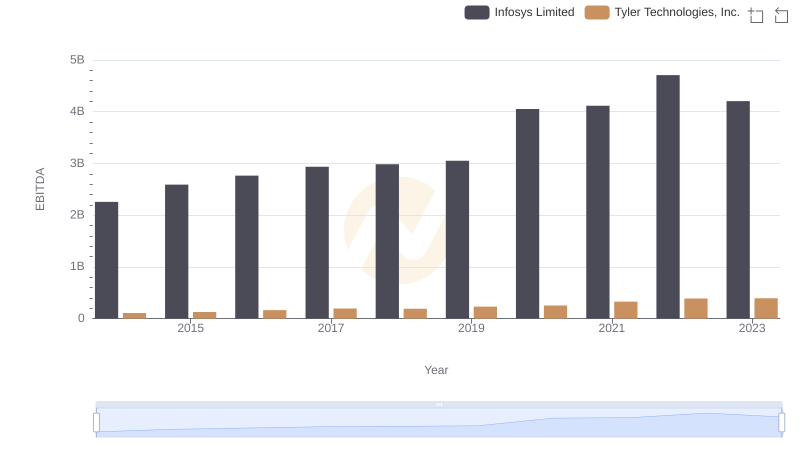
Comprehensive EBITDA Comparison: Infosys Limited vs Tyler Technologies, Inc.
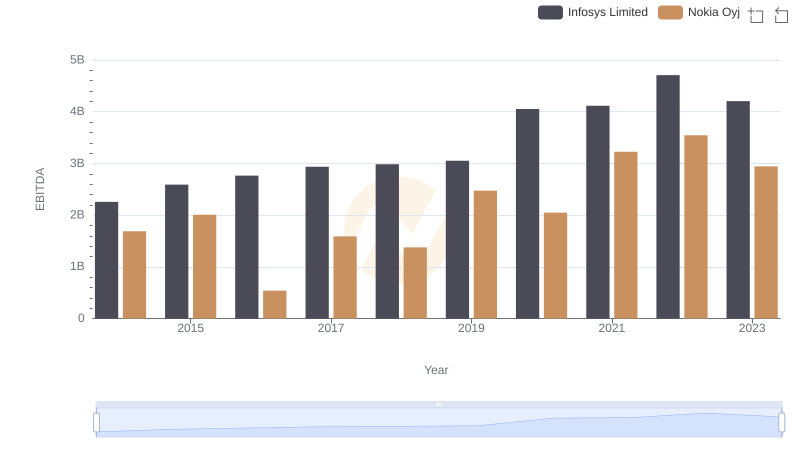
Infosys Limited vs Nokia Oyj: In-Depth EBITDA Performance Comparison