| __timestamp | HP Inc. | Infosys Limited |
|---|---|---|
| Wednesday, January 1, 2014 | 13353000000 | 1079000000 |
| Thursday, January 1, 2015 | 4720000000 | 1176000000 |
| Friday, January 1, 2016 | 3840000000 | 1020000000 |
| Sunday, January 1, 2017 | 4376000000 | 1279000000 |
| Monday, January 1, 2018 | 4866000000 | 1220000000 |
| Tuesday, January 1, 2019 | 5368000000 | 1504000000 |
| Wednesday, January 1, 2020 | 4906000000 | 1223000000 |
| Friday, January 1, 2021 | 5741000000 | 1391000000 |
| Saturday, January 1, 2022 | 5264000000 | 1678000000 |
| Sunday, January 1, 2023 | 5356000000 | 1632000000 |
| Monday, January 1, 2024 | 5658000000 |
Igniting the spark of knowledge
In the ever-evolving tech landscape, understanding the financial strategies of industry leaders is crucial. This analysis delves into the Selling, General, and Administrative (SG&A) expenses of Infosys Limited and HP Inc. from 2014 to 2023. Over this decade, HP Inc. consistently outspent Infosys, with its SG&A expenses peaking in 2014 at nearly 10 times that of Infosys. However, HP's spending saw a significant decline of about 64% by 2016, stabilizing around 5.5 billion USD in recent years. In contrast, Infosys demonstrated a steady increase, with its SG&A expenses growing by approximately 51% from 2014 to 2023. This divergence highlights differing strategic priorities: HP's focus on cost optimization versus Infosys's investment in growth. Notably, data for 2024 is incomplete, reflecting the dynamic nature of financial reporting.
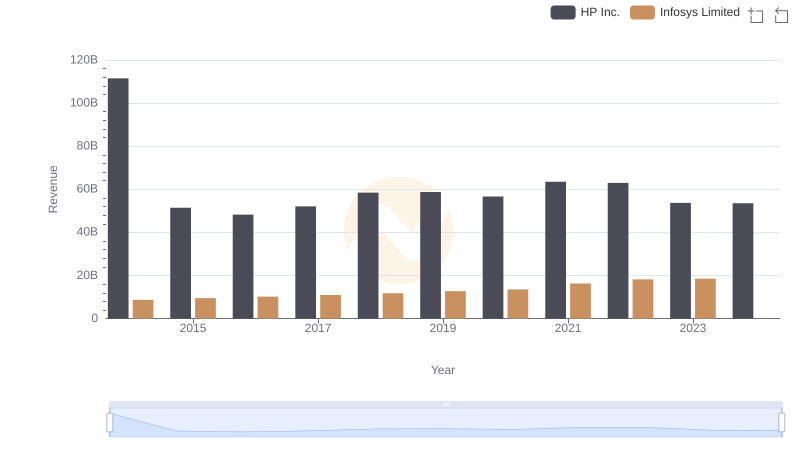
Infosys Limited and HP Inc.: A Comprehensive Revenue Analysis
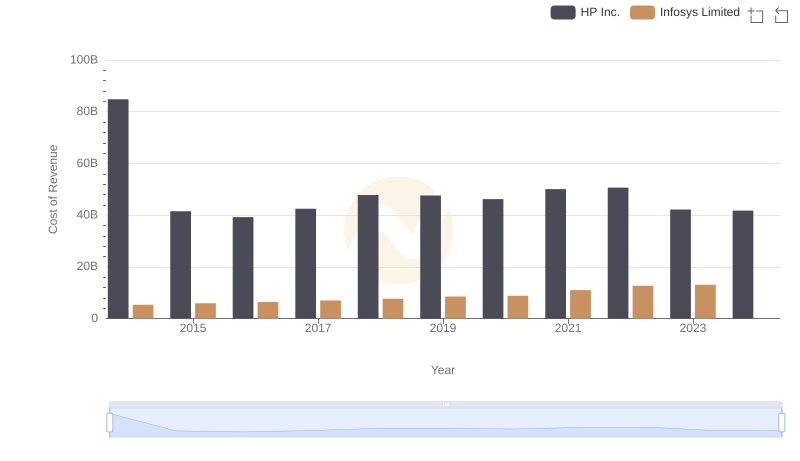
Analyzing Cost of Revenue: Infosys Limited and HP Inc.

Gross Profit Trends Compared: Infosys Limited vs HP Inc.
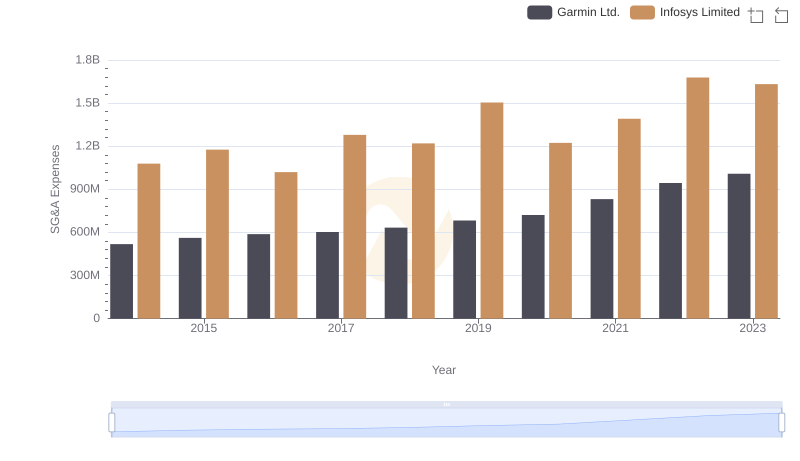
Infosys Limited and Garmin Ltd.: SG&A Spending Patterns Compared
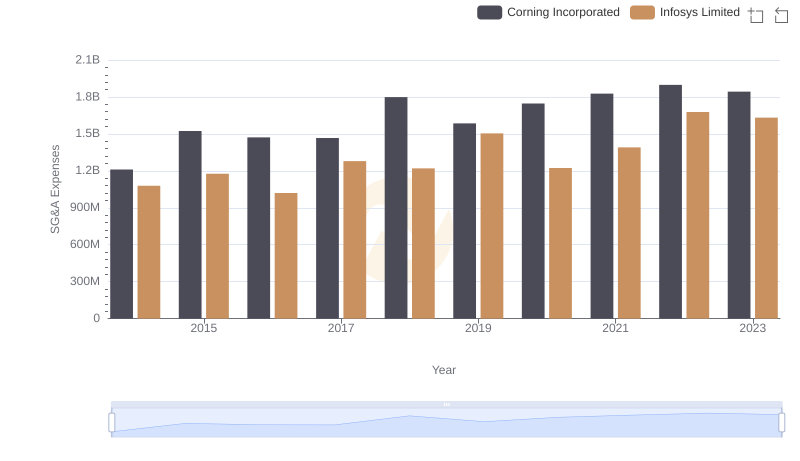
Selling, General, and Administrative Costs: Infosys Limited vs Corning Incorporated
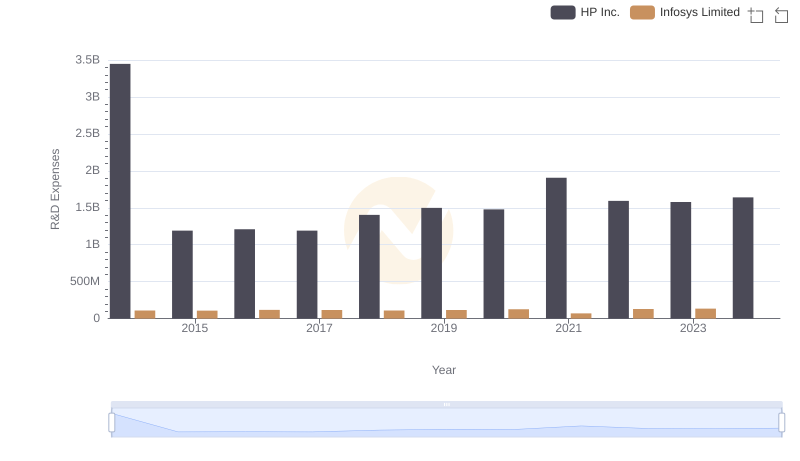
Who Prioritizes Innovation? R&D Spending Compared for Infosys Limited and HP Inc.
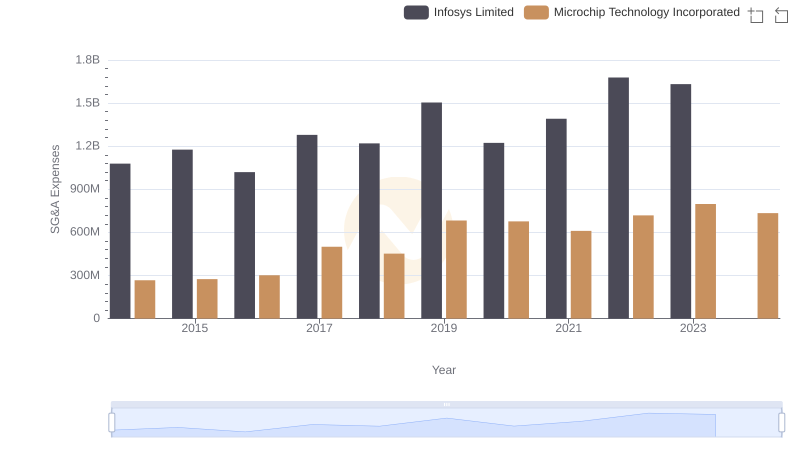
Comparing SG&A Expenses: Infosys Limited vs Microchip Technology Incorporated Trends and Insights
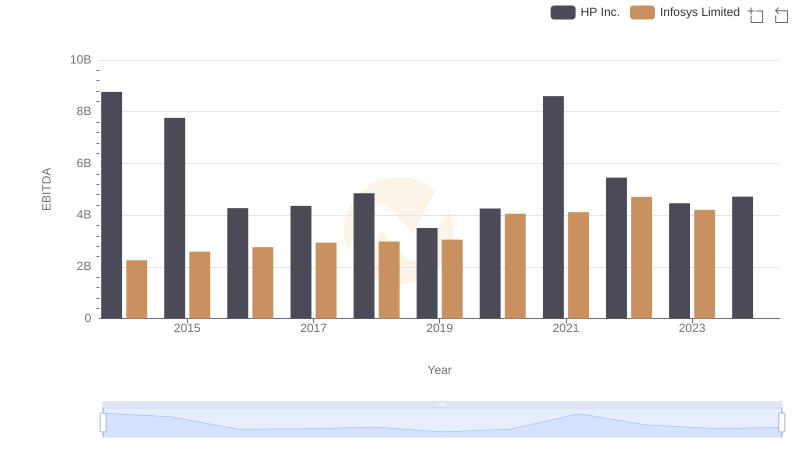
Infosys Limited and HP Inc.: A Detailed Examination of EBITDA Performance
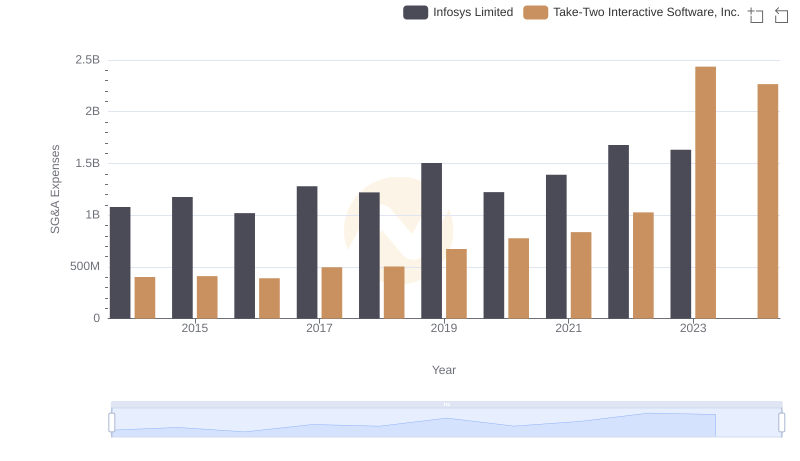
Who Optimizes SG&A Costs Better? Infosys Limited or Take-Two Interactive Software, Inc.
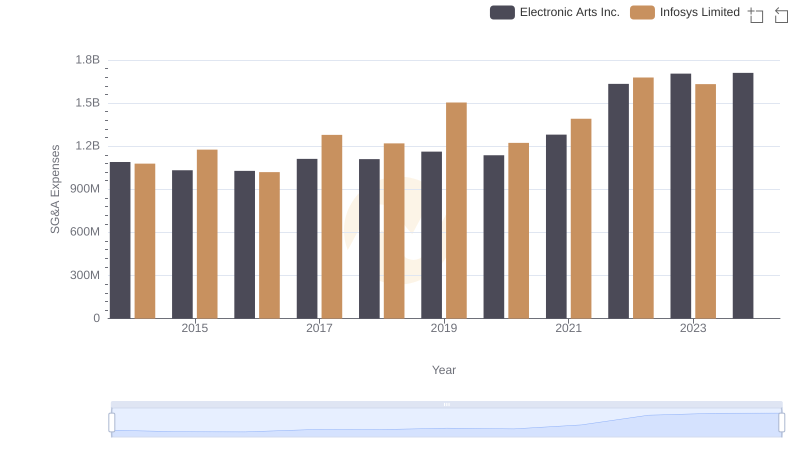
Infosys Limited or Electronic Arts Inc.: Who Manages SG&A Costs Better?
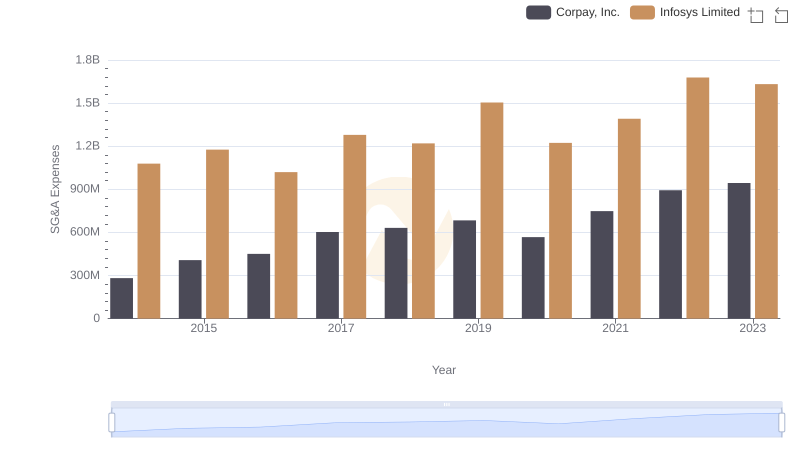
Comparing SG&A Expenses: Infosys Limited vs Corpay, Inc. Trends and Insights
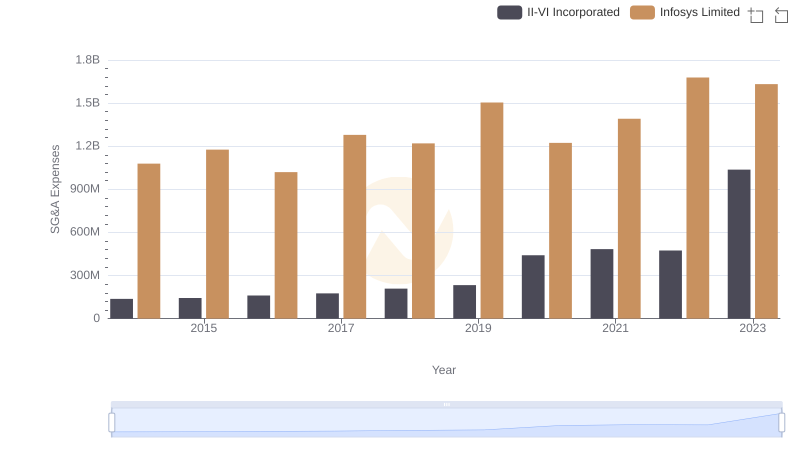
Cost Management Insights: SG&A Expenses for Infosys Limited and II-VI Incorporated