| __timestamp | HP Inc. | Infosys Limited |
|---|---|---|
| Wednesday, January 1, 2014 | 8766000000 | 2258000000 |
| Thursday, January 1, 2015 | 7760000000 | 2590000000 |
| Friday, January 1, 2016 | 4272000000 | 2765000000 |
| Sunday, January 1, 2017 | 4359000000 | 2936000000 |
| Monday, January 1, 2018 | 4847000000 | 2984000000 |
| Tuesday, January 1, 2019 | 3504000000 | 3053000000 |
| Wednesday, January 1, 2020 | 4256000000 | 4053342784 |
| Friday, January 1, 2021 | 8603000000 | 4116000000 |
| Saturday, January 1, 2022 | 5453000000 | 4707334610 |
| Sunday, January 1, 2023 | 4462000000 | 4206000000 |
| Monday, January 1, 2024 | 4716000000 |
In pursuit of knowledge
In the ever-evolving landscape of global technology, the financial performance of industry giants like Infosys Limited and HP Inc. offers valuable insights. Over the past decade, from 2014 to 2023, these companies have showcased distinct trajectories in their EBITDA performance.
Infosys Limited has demonstrated a consistent upward trend, with EBITDA growing by approximately 86% from 2014 to 2023. Notably, the company reached its peak in 2022, with an EBITDA of around $4.7 billion, reflecting its robust growth strategy and market adaptability.
Conversely, HP Inc. experienced a more volatile journey. Starting strong in 2014, its EBITDA saw fluctuations, peaking in 2021 before a slight decline. Despite these variations, HP Inc. maintained a competitive edge, with an average EBITDA of $5.5 billion over the period.
The data highlights the contrasting financial strategies and market responses of these tech titans, offering a fascinating glimpse into their operational dynamics.
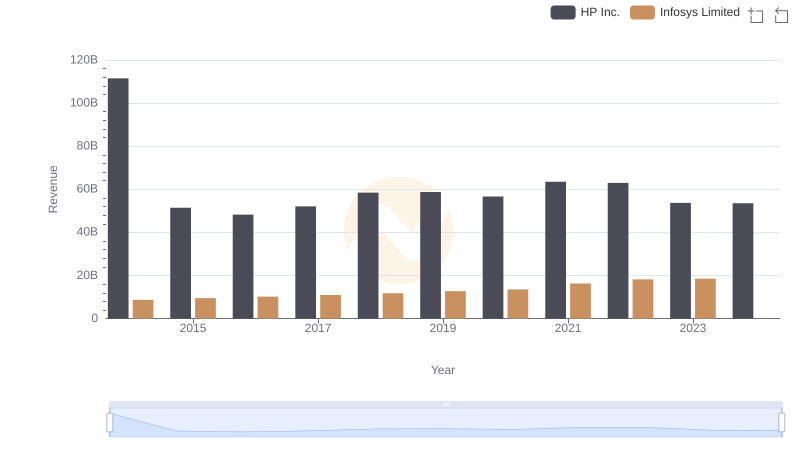
Infosys Limited and HP Inc.: A Comprehensive Revenue Analysis
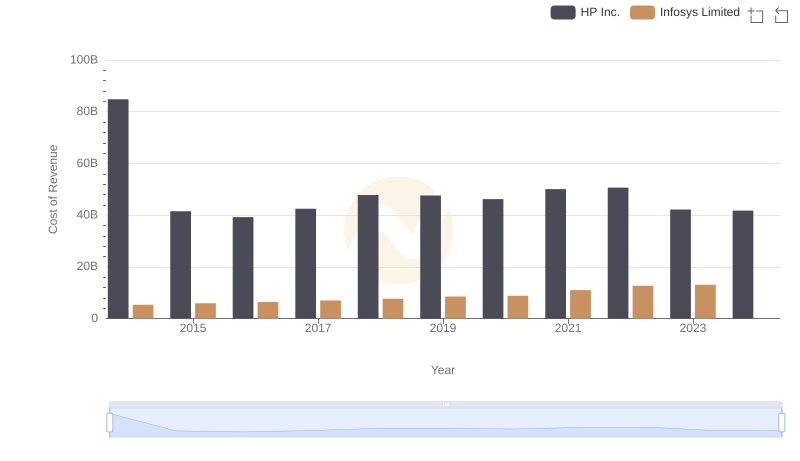
Analyzing Cost of Revenue: Infosys Limited and HP Inc.

Gross Profit Trends Compared: Infosys Limited vs HP Inc.
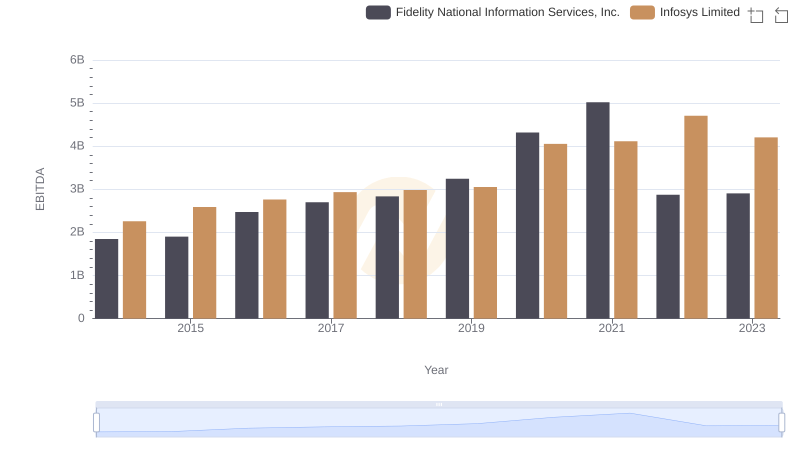
A Professional Review of EBITDA: Infosys Limited Compared to Fidelity National Information Services, Inc.
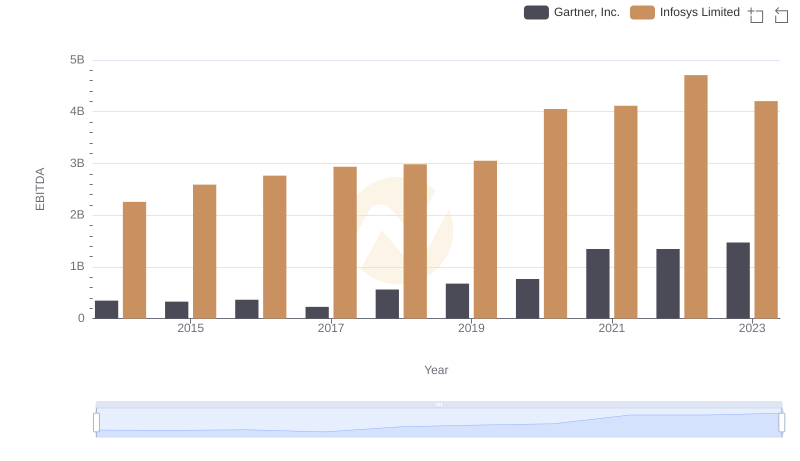
A Side-by-Side Analysis of EBITDA: Infosys Limited and Gartner, Inc.
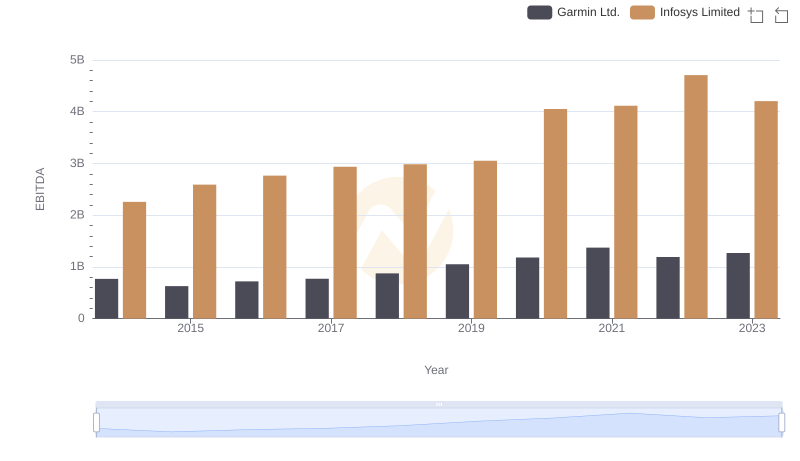
EBITDA Analysis: Evaluating Infosys Limited Against Garmin Ltd.
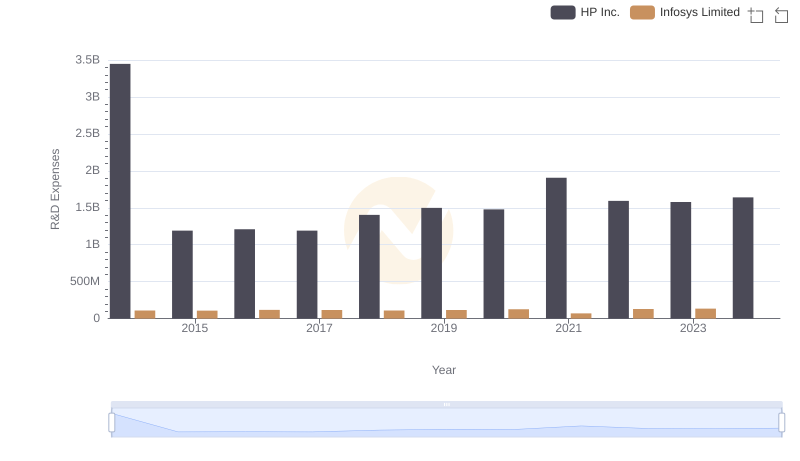
Who Prioritizes Innovation? R&D Spending Compared for Infosys Limited and HP Inc.
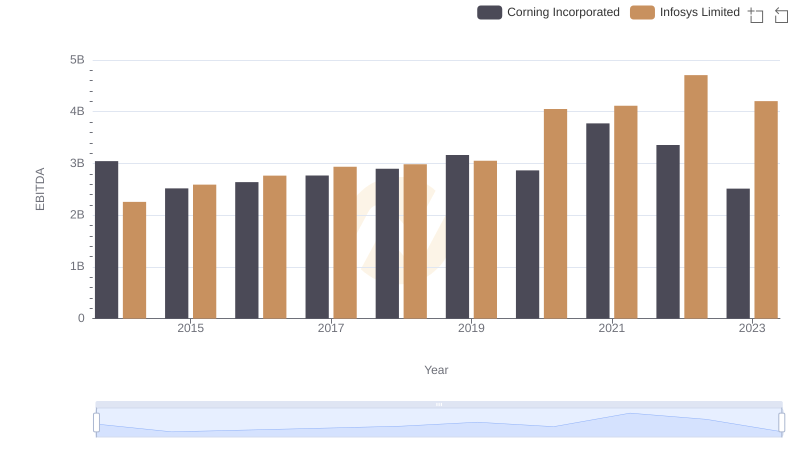
Comprehensive EBITDA Comparison: Infosys Limited vs Corning Incorporated
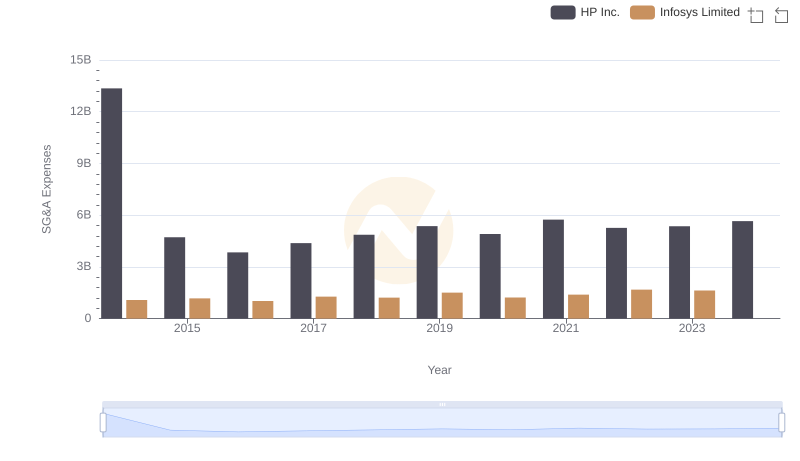
Infosys Limited and HP Inc.: SG&A Spending Patterns Compared
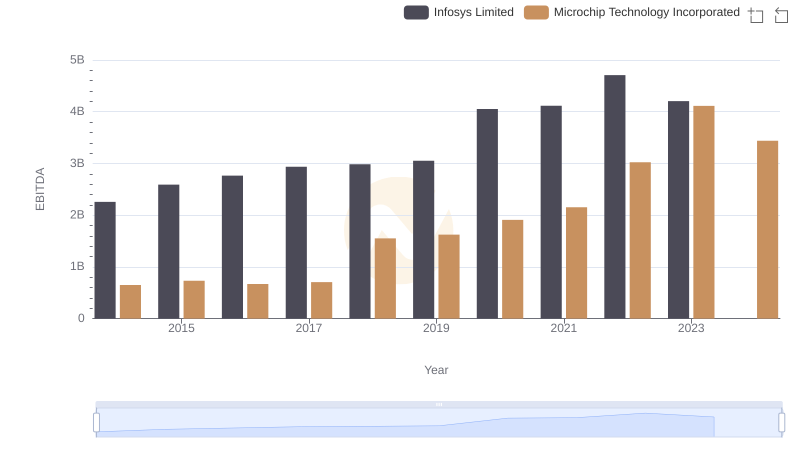
EBITDA Performance Review: Infosys Limited vs Microchip Technology Incorporated
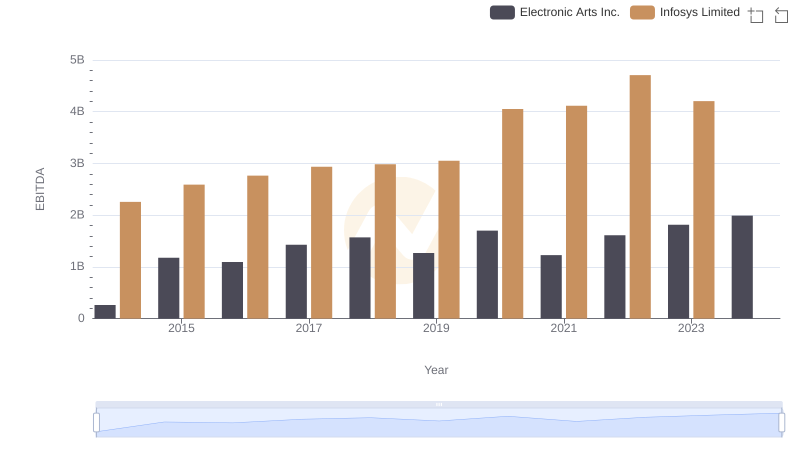
A Side-by-Side Analysis of EBITDA: Infosys Limited and Electronic Arts Inc.
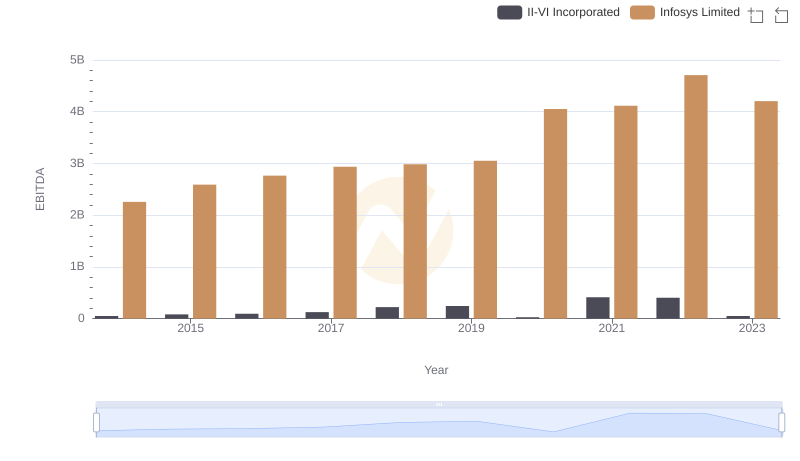
A Professional Review of EBITDA: Infosys Limited Compared to II-VI Incorporated