| __timestamp | HP Inc. | Infosys Limited |
|---|---|---|
| Wednesday, January 1, 2014 | 111454000000 | 8711000000 |
| Thursday, January 1, 2015 | 51463000000 | 9501000000 |
| Friday, January 1, 2016 | 48238000000 | 10208000000 |
| Sunday, January 1, 2017 | 52056000000 | 10939000000 |
| Monday, January 1, 2018 | 58472000000 | 11799000000 |
| Tuesday, January 1, 2019 | 58756000000 | 12780000000 |
| Wednesday, January 1, 2020 | 56639000000 | 13561000000 |
| Friday, January 1, 2021 | 63487000000 | 16311000000 |
| Saturday, January 1, 2022 | 62983000000 | 18212000000 |
| Sunday, January 1, 2023 | 53718000000 | 18562000000 |
| Monday, January 1, 2024 | 53559000000 |
Unleashing the power of data
In the ever-evolving landscape of global technology, Infosys Limited and HP Inc. stand as titans, each with a unique trajectory. From 2014 to 2023, HP Inc. experienced a revenue rollercoaster, peaking in 2014 with a staggering 111 billion USD, only to see a decline of nearly 52% by 2023. Meanwhile, Infosys Limited showcased a steady ascent, with revenues growing by over 110% from 2014 to 2023, reaching approximately 18.6 billion USD.
This analysis underscores the dynamic nature of the tech industry, where adaptability and innovation are key to sustained growth.
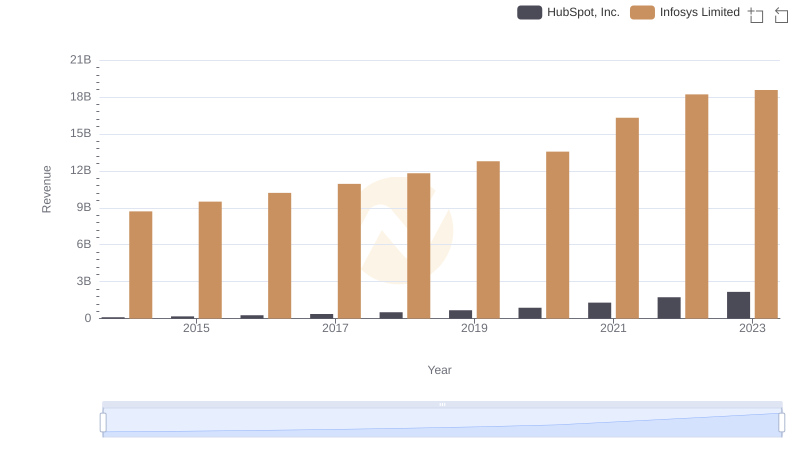
Breaking Down Revenue Trends: Infosys Limited vs HubSpot, Inc.
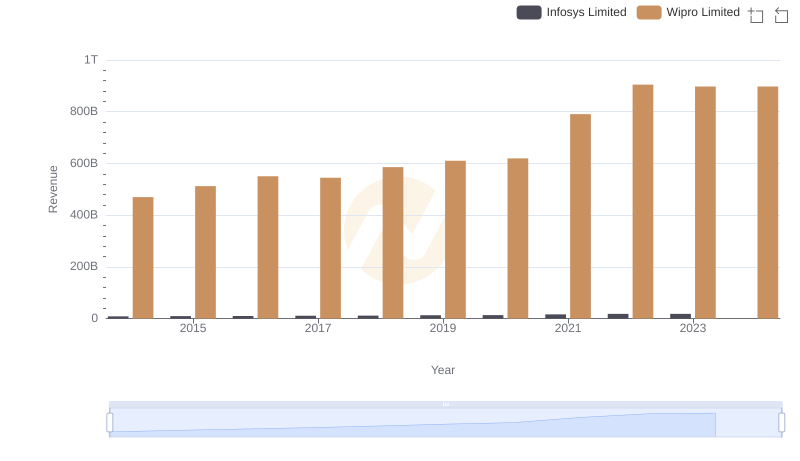
Infosys Limited vs Wipro Limited: Examining Key Revenue Metrics
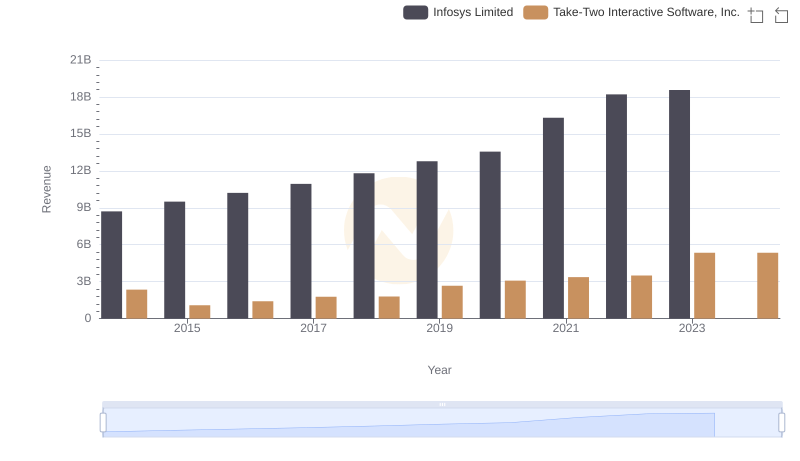
Infosys Limited vs Take-Two Interactive Software, Inc.: Examining Key Revenue Metrics
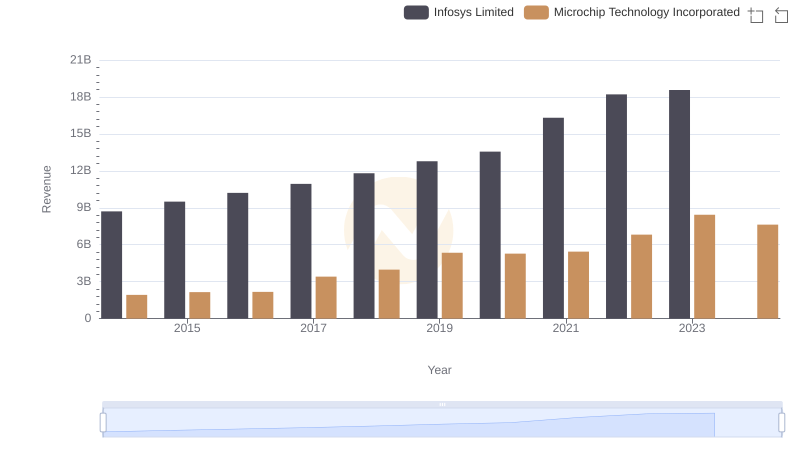
Infosys Limited or Microchip Technology Incorporated: Who Leads in Yearly Revenue?
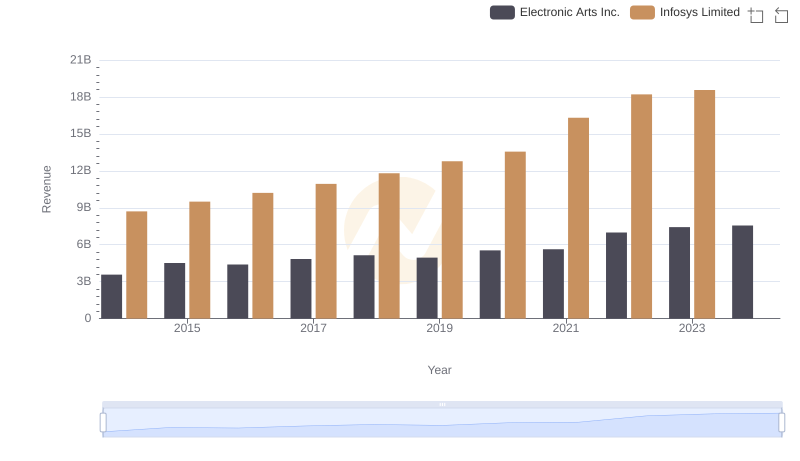
Infosys Limited vs Electronic Arts Inc.: Annual Revenue Growth Compared
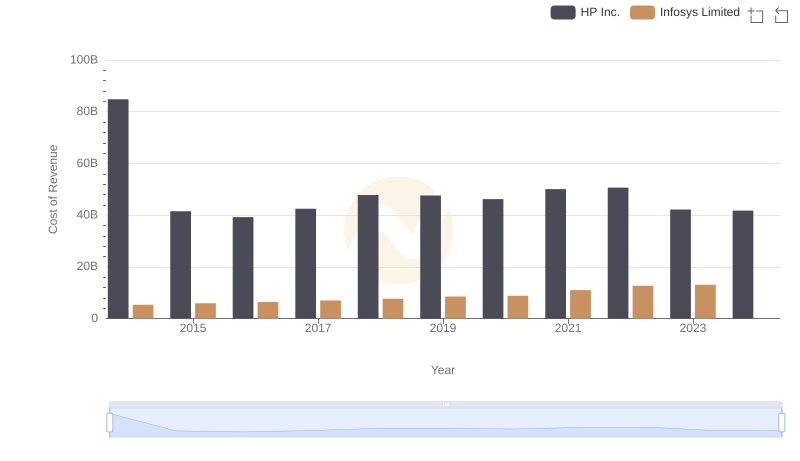
Analyzing Cost of Revenue: Infosys Limited and HP Inc.
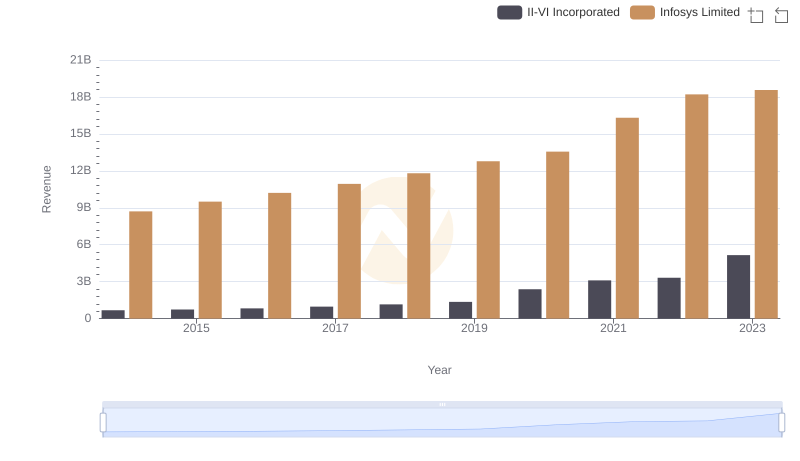
Comparing Revenue Performance: Infosys Limited or II-VI Incorporated?

Gross Profit Trends Compared: Infosys Limited vs HP Inc.
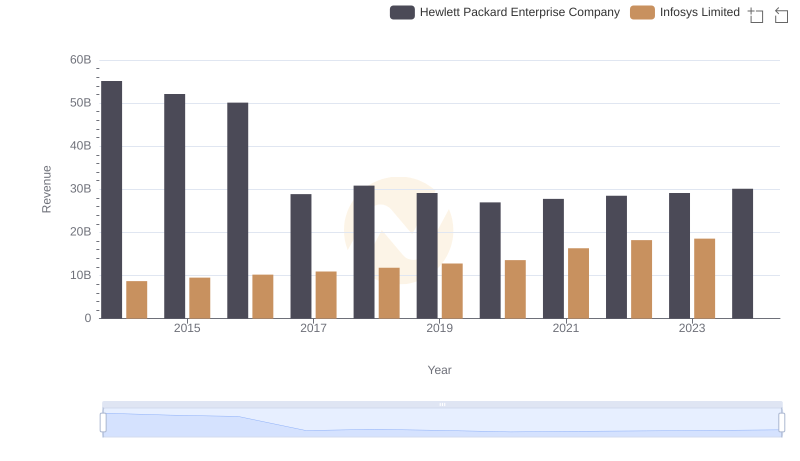
Comparing Revenue Performance: Infosys Limited or Hewlett Packard Enterprise Company?
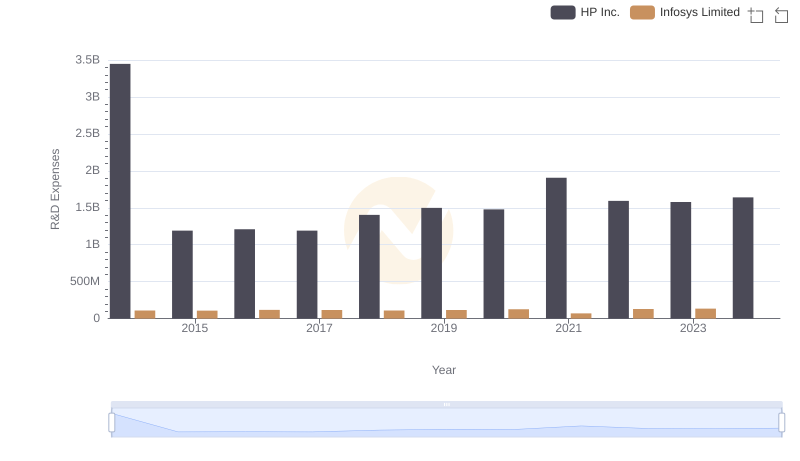
Who Prioritizes Innovation? R&D Spending Compared for Infosys Limited and HP Inc.
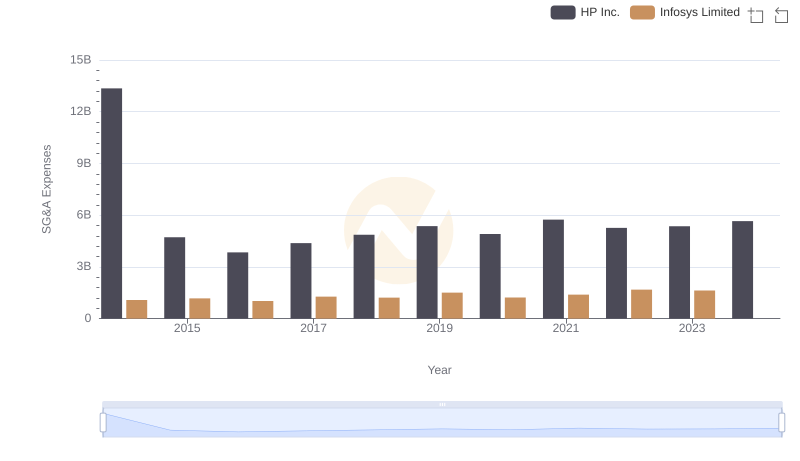
Infosys Limited and HP Inc.: SG&A Spending Patterns Compared
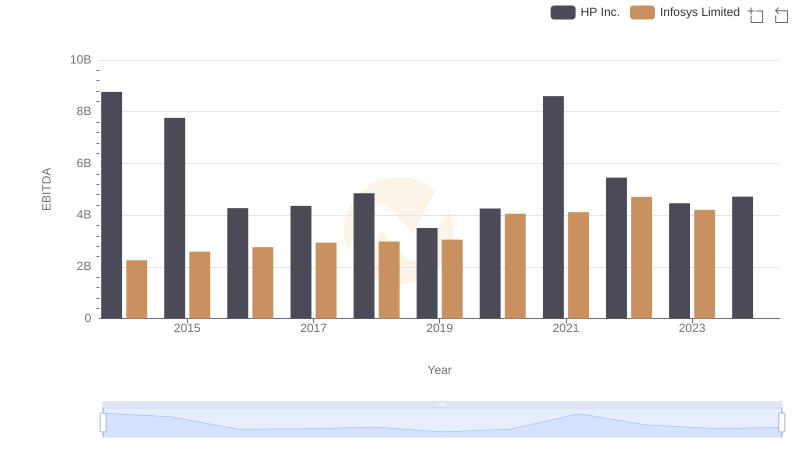
Infosys Limited and HP Inc.: A Detailed Examination of EBITDA Performance