| __timestamp | HP Inc. | Infosys Limited |
|---|---|---|
| Wednesday, January 1, 2014 | 26615000000 | 3337000000 |
| Thursday, January 1, 2015 | 9939000000 | 3551000000 |
| Friday, January 1, 2016 | 8998000000 | 3762000000 |
| Sunday, January 1, 2017 | 9578000000 | 3938000000 |
| Monday, January 1, 2018 | 10669000000 | 4112000000 |
| Tuesday, January 1, 2019 | 11170000000 | 4228000000 |
| Wednesday, January 1, 2020 | 10437000000 | 4733000000 |
| Friday, January 1, 2021 | 13417000000 | 5315000000 |
| Saturday, January 1, 2022 | 12335000000 | 5503000000 |
| Sunday, January 1, 2023 | 11508000000 | 5466000000 |
| Monday, January 1, 2024 | 11818000000 |
Igniting the spark of knowledge
In the ever-evolving landscape of technology, the financial performance of industry leaders like Infosys Limited and HP Inc. offers a fascinating glimpse into their strategic maneuvers. Over the past decade, HP Inc. has demonstrated a robust gross profit trajectory, peaking in 2014 with a remarkable 266% higher profit than its 2023 figures. Despite a dip in 2016, HP Inc. has maintained a steady growth, with a 28% increase from 2016 to 2023.
Conversely, Infosys Limited has shown a consistent upward trend, with its gross profit growing by approximately 64% from 2014 to 2023. Notably, Infosys achieved its highest gross profit in 2022, marking a 65% increase from its 2014 figures. However, data for 2024 remains elusive, leaving room for speculation on future performance. This comparison underscores the dynamic nature of the tech industry, where strategic decisions and market conditions shape financial outcomes.
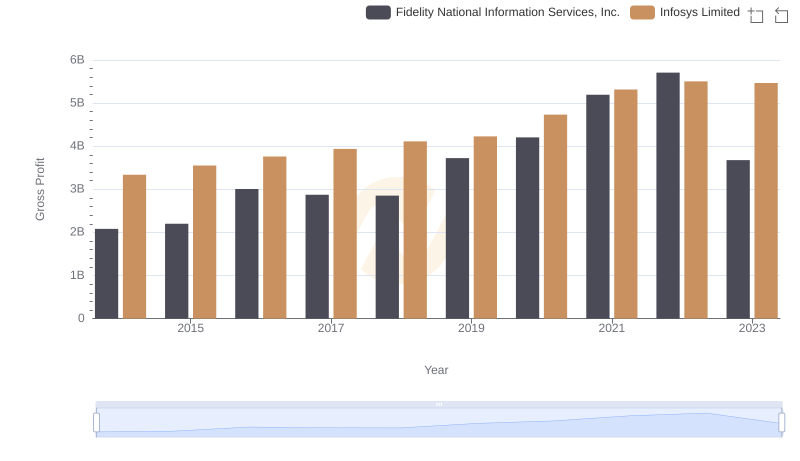
Who Generates Higher Gross Profit? Infosys Limited or Fidelity National Information Services, Inc.
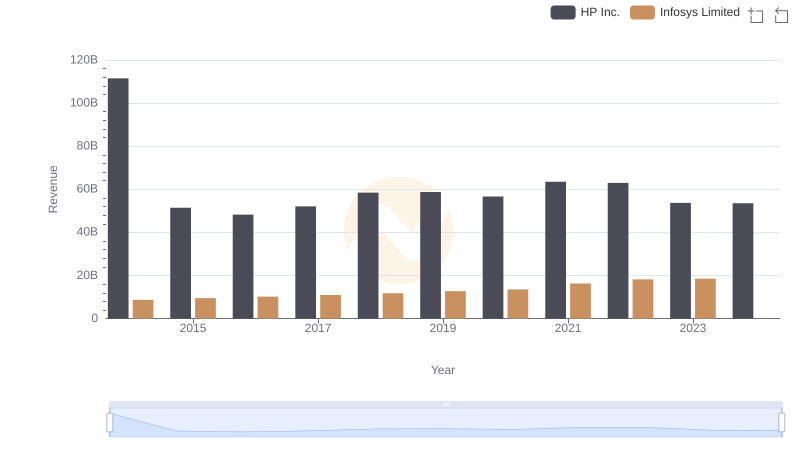
Infosys Limited and HP Inc.: A Comprehensive Revenue Analysis
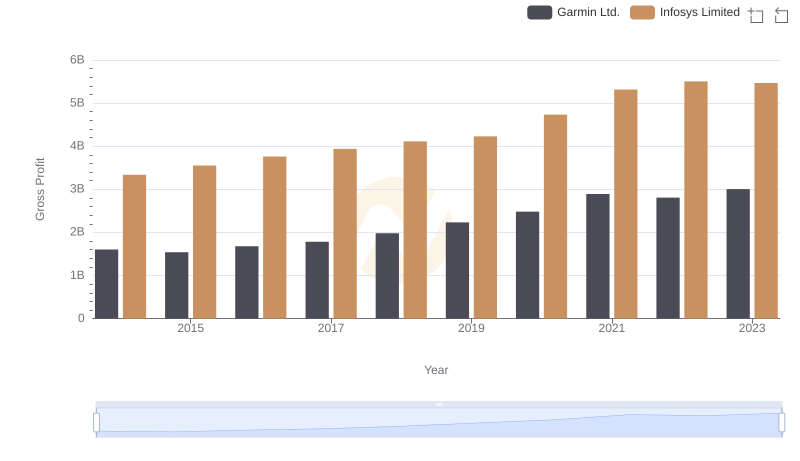
Key Insights on Gross Profit: Infosys Limited vs Garmin Ltd.
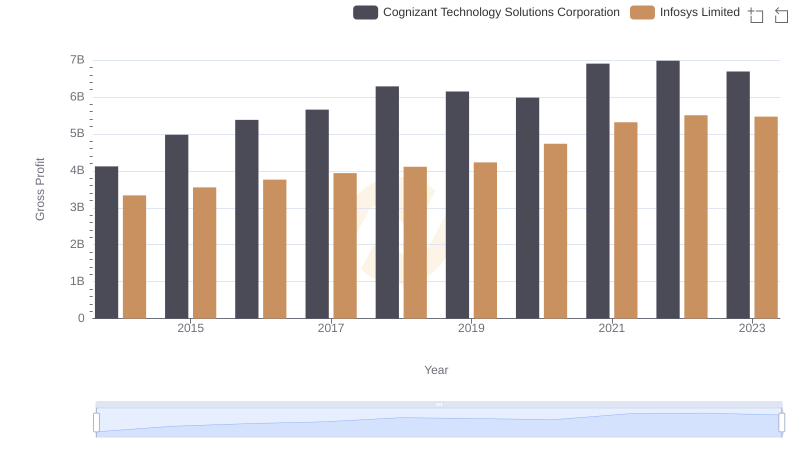
Infosys Limited and Cognizant Technology Solutions Corporation: A Detailed Gross Profit Analysis
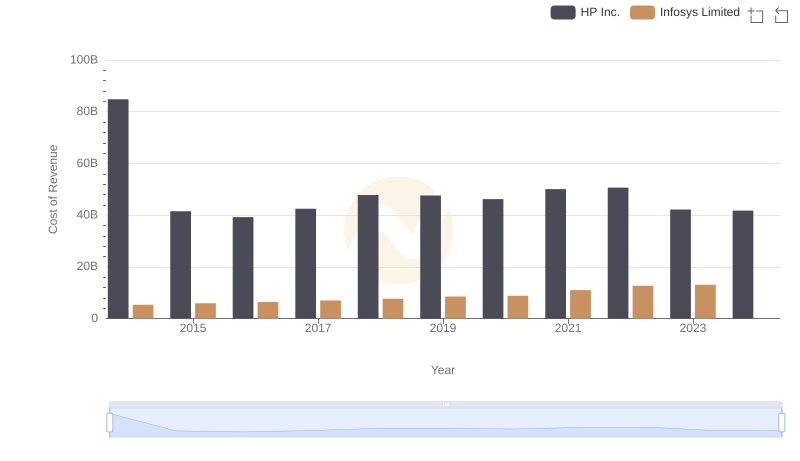
Analyzing Cost of Revenue: Infosys Limited and HP Inc.
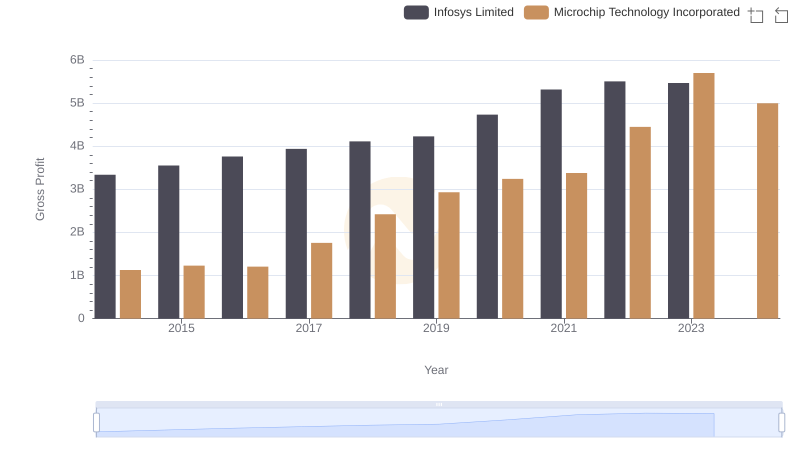
Gross Profit Analysis: Comparing Infosys Limited and Microchip Technology Incorporated
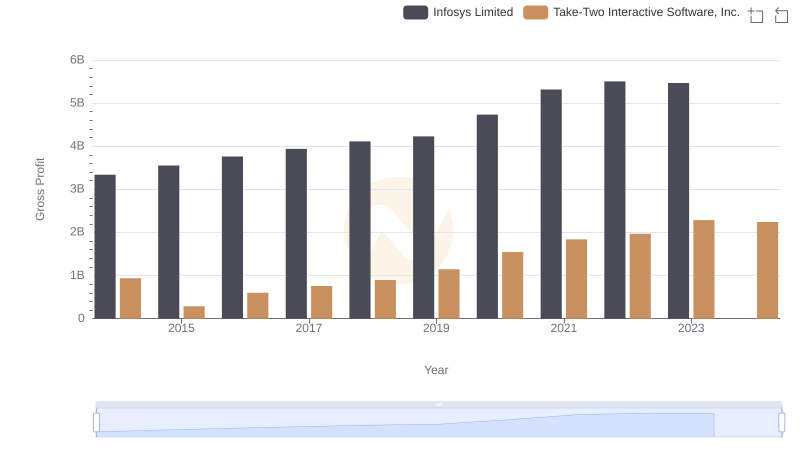
Gross Profit Trends Compared: Infosys Limited vs Take-Two Interactive Software, Inc.
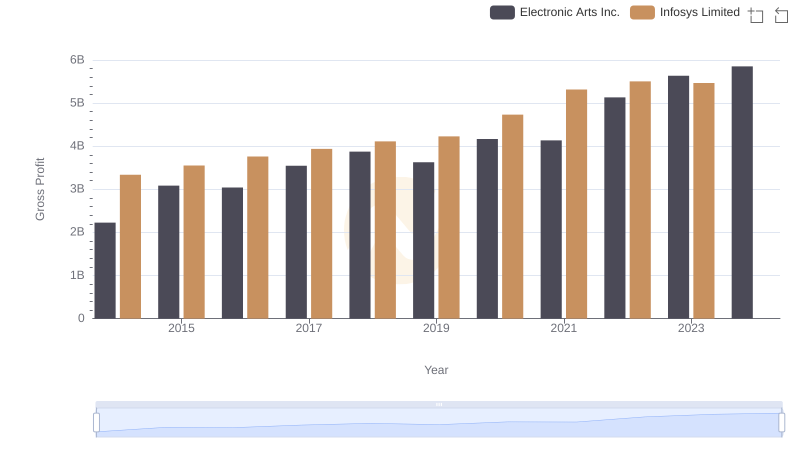
Who Generates Higher Gross Profit? Infosys Limited or Electronic Arts Inc.
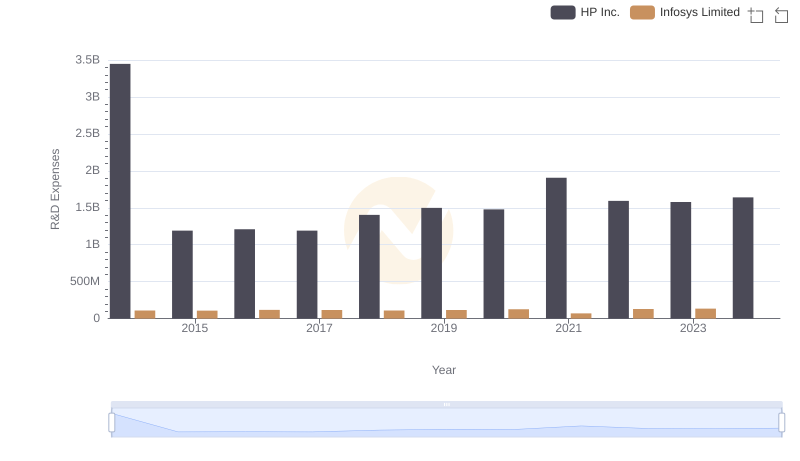
Who Prioritizes Innovation? R&D Spending Compared for Infosys Limited and HP Inc.
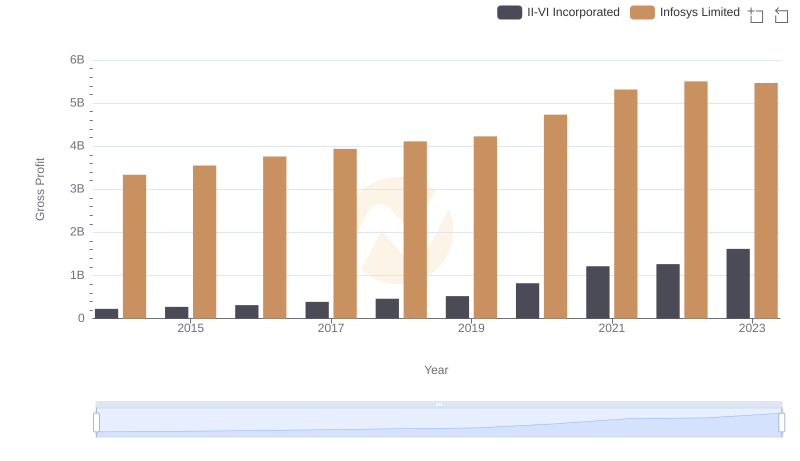
Key Insights on Gross Profit: Infosys Limited vs II-VI Incorporated
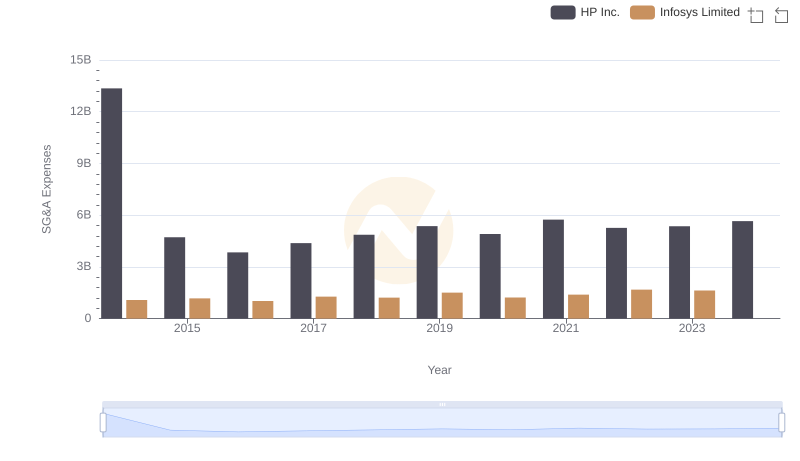
Infosys Limited and HP Inc.: SG&A Spending Patterns Compared
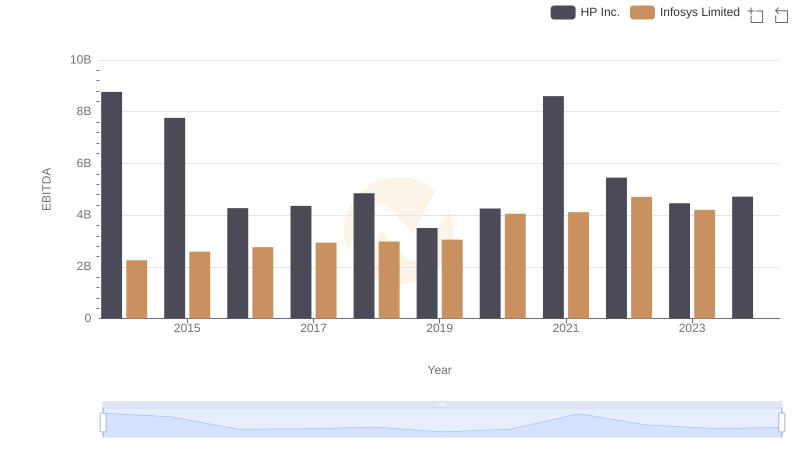
Infosys Limited and HP Inc.: A Detailed Examination of EBITDA Performance