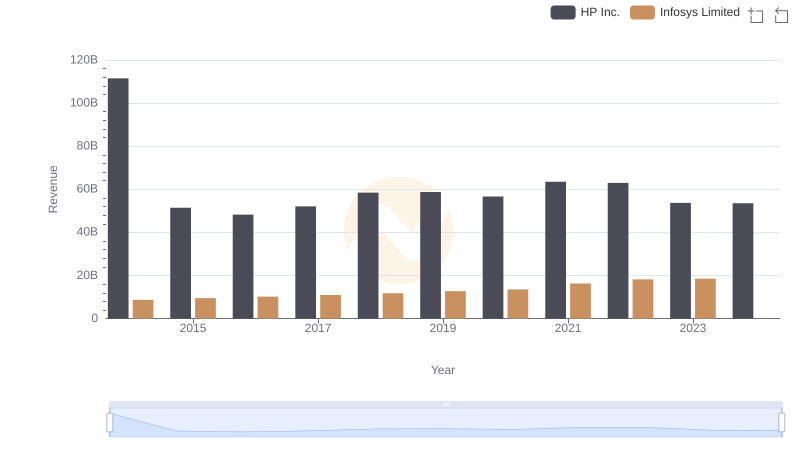
| __timestamp | HP Inc. | Infosys Limited |
|---|---|---|
| Wednesday, January 1, 2014 | 84839000000 | 5374000000 |
| Thursday, January 1, 2015 | 41524000000 | 5950000000 |
| Friday, January 1, 2016 | 39240000000 | 6446000000 |
| Sunday, January 1, 2017 | 42478000000 | 7001000000 |
| Monday, January 1, 2018 | 47803000000 | 7687000000 |
| Tuesday, January 1, 2019 | 47586000000 | 8552000000 |
| Wednesday, January 1, 2020 | 46202000000 | 8828000000 |
| Friday, January 1, 2021 | 50070000000 | 10996000000 |
| Saturday, January 1, 2022 | 50648000000 | 12709000000 |
| Sunday, January 1, 2023 | 42210000000 | 13096000000 |
| Monday, January 1, 2024 | 41741000000 |
Unleashing the power of data
In the ever-evolving landscape of global technology, understanding the cost dynamics of industry giants like Infosys Limited and HP Inc. is crucial. Over the past decade, HP Inc. has consistently maintained a higher cost of revenue compared to Infosys, reflecting its expansive hardware operations. In 2014, HP's cost of revenue was nearly 16 times that of Infosys, highlighting the scale of its operations. However, by 2023, Infosys has shown a remarkable growth trajectory, with its cost of revenue increasing by over 140%, while HP's has seen a more modest decline of around 50% from its 2014 peak. This shift underscores Infosys's expanding footprint in the IT services sector. As we look to the future, the absence of data for 2024 for Infosys suggests a potential shift or strategic change, inviting investors and analysts to keep a keen eye on these industry leaders.
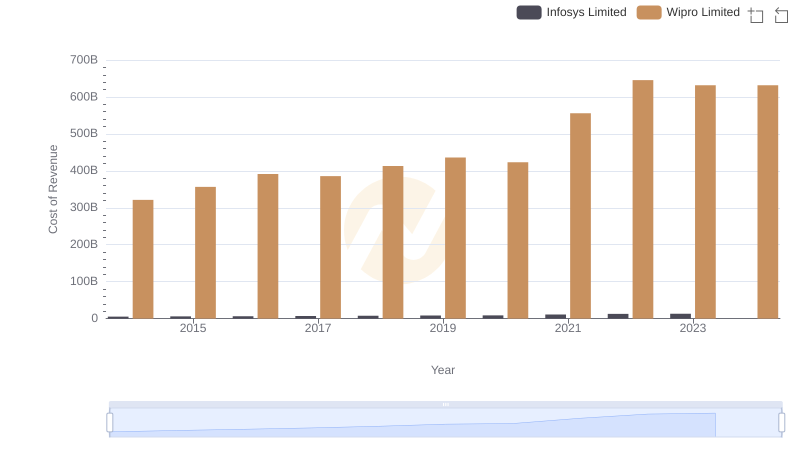
Comparing Cost of Revenue Efficiency: Infosys Limited vs Wipro Limited
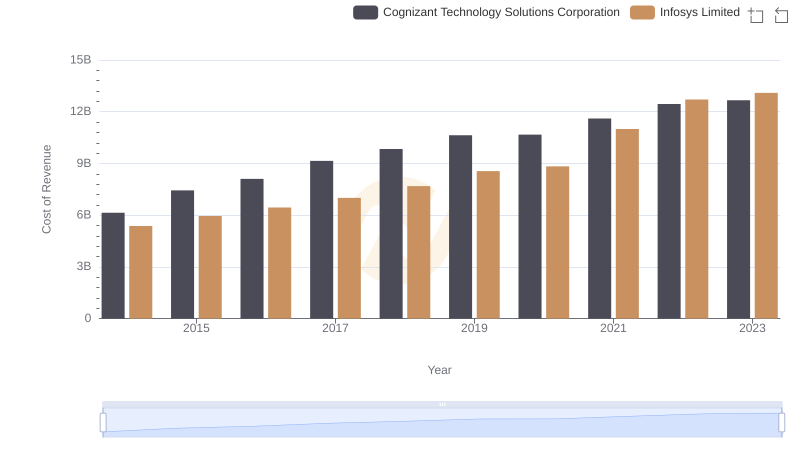
Comparing Cost of Revenue Efficiency: Infosys Limited vs Cognizant Technology Solutions Corporation
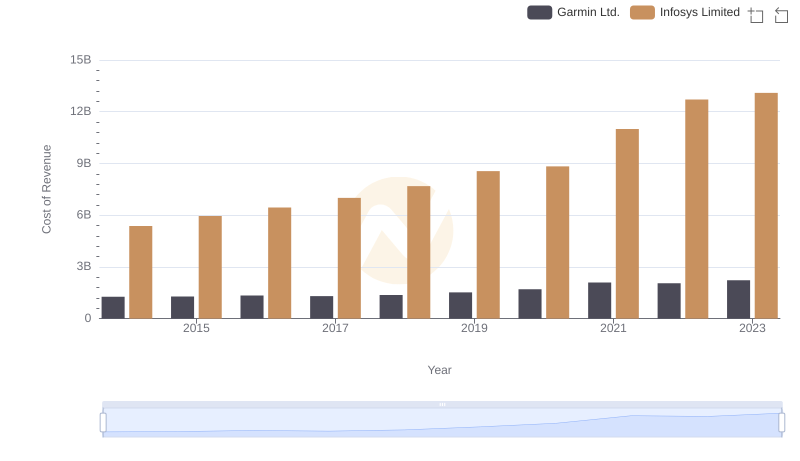
Cost of Revenue Comparison: Infosys Limited vs Garmin Ltd.
Infosys Limited and HP Inc.: A Comprehensive Revenue Analysis
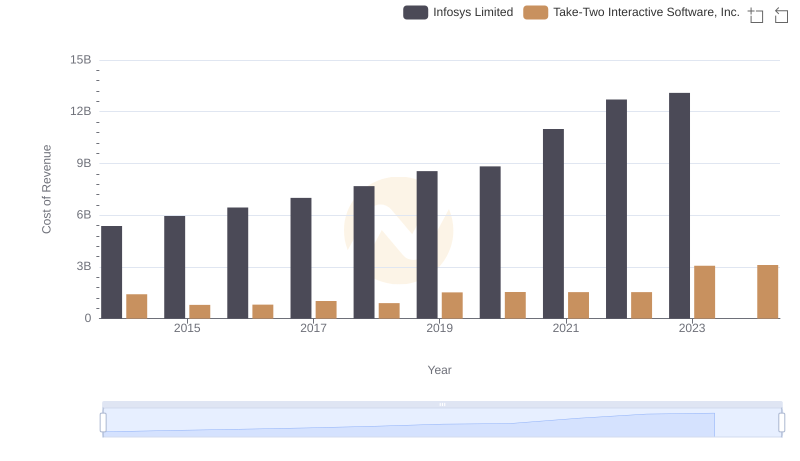
Analyzing Cost of Revenue: Infosys Limited and Take-Two Interactive Software, Inc.
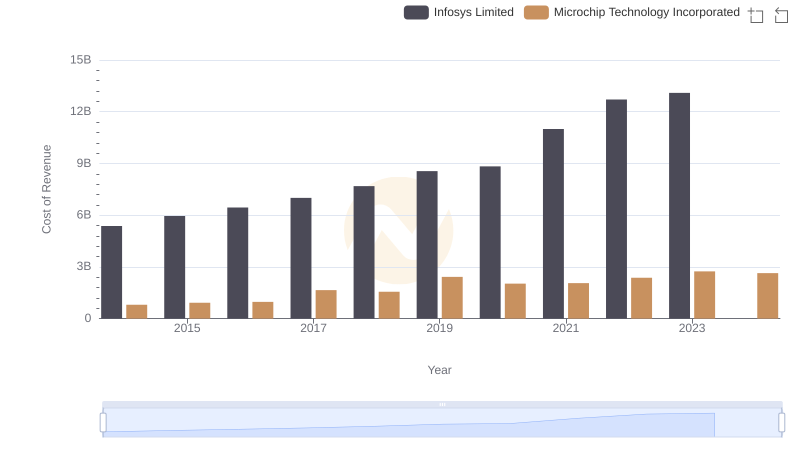
Cost Insights: Breaking Down Infosys Limited and Microchip Technology Incorporated's Expenses

Gross Profit Trends Compared: Infosys Limited vs HP Inc.
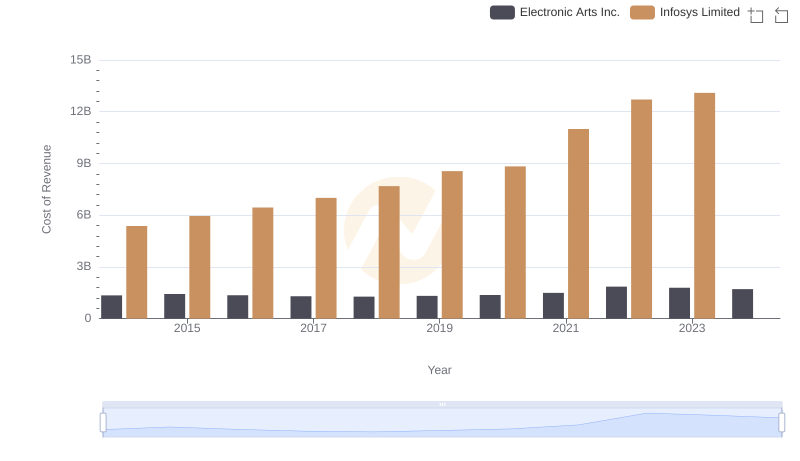
Analyzing Cost of Revenue: Infosys Limited and Electronic Arts Inc.
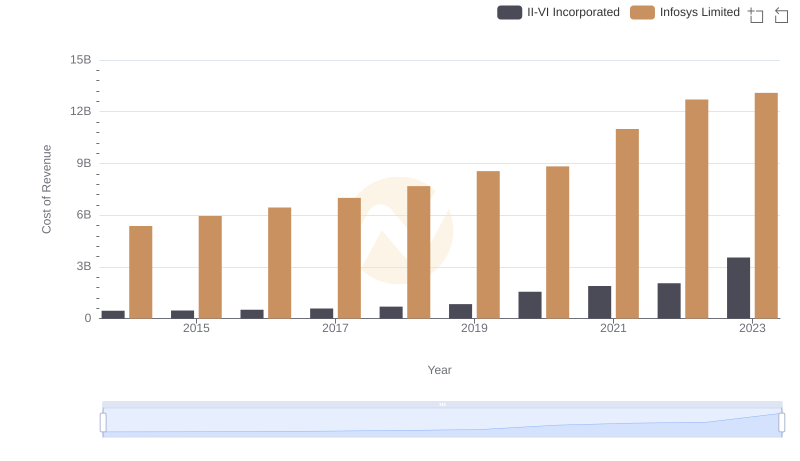
Analyzing Cost of Revenue: Infosys Limited and II-VI Incorporated
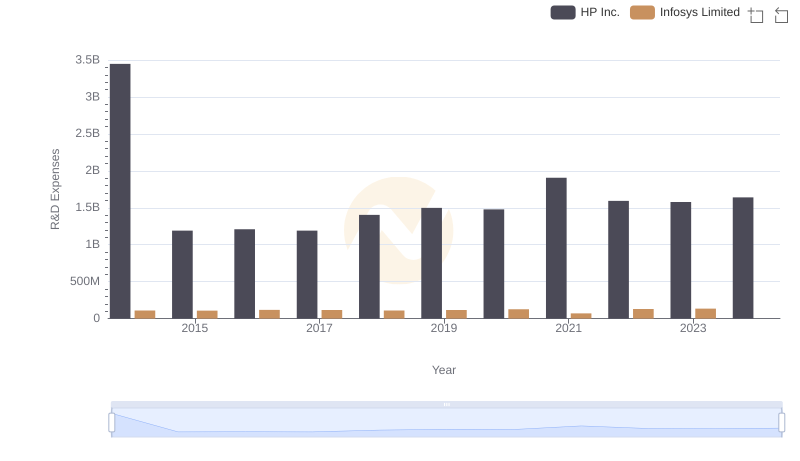
Who Prioritizes Innovation? R&D Spending Compared for Infosys Limited and HP Inc.
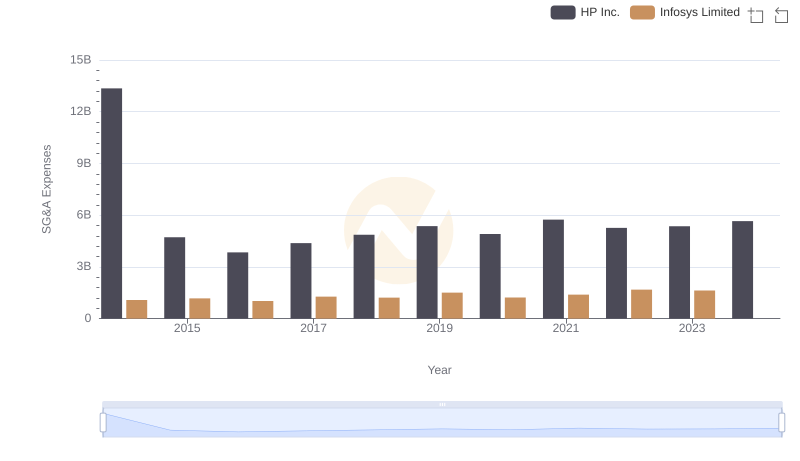
Infosys Limited and HP Inc.: SG&A Spending Patterns Compared
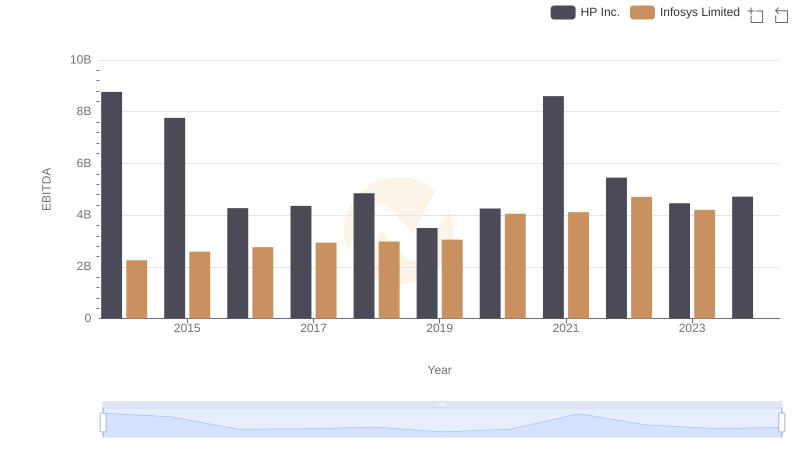
Infosys Limited and HP Inc.: A Detailed Examination of EBITDA Performance