| __timestamp | Stanley Black & Decker, Inc. | Watsco, Inc. |
|---|---|---|
| Wednesday, January 1, 2014 | 4102700000 | 956402000 |
| Thursday, January 1, 2015 | 4072000000 | 1007357000 |
| Friday, January 1, 2016 | 4267200000 | 1034584000 |
| Sunday, January 1, 2017 | 4778000000 | 1065659000 |
| Monday, January 1, 2018 | 4901900000 | 1120252000 |
| Tuesday, January 1, 2019 | 4805500000 | 1156956000 |
| Wednesday, January 1, 2020 | 4967900000 | 1222821000 |
| Friday, January 1, 2021 | 5194200000 | 1667545000 |
| Saturday, January 1, 2022 | 4284100000 | 2030289000 |
| Sunday, January 1, 2023 | 4098000000 | 1992140000 |
| Monday, January 1, 2024 | 4514400000 | 2044713000 |
In pursuit of knowledge
In the ever-evolving landscape of industrial and consumer goods, Watsco, Inc. and Stanley Black & Decker, Inc. have emerged as formidable players. Over the past decade, from 2014 to 2023, these companies have showcased contrasting trajectories in gross profit growth.
Watsco, Inc. has demonstrated a remarkable upward trend, with its gross profit nearly doubling, peaking in 2022. This growth reflects a robust strategy in the HVAC distribution sector, capitalizing on increased demand and efficient operations. In contrast, Stanley Black & Decker, Inc. experienced fluctuations, with a peak in 2021 followed by a decline. This volatility highlights challenges in the tools and storage market, possibly due to global supply chain disruptions.
As we look to the future, these insights provide a window into the strategic maneuvers that could shape the industrial landscape.
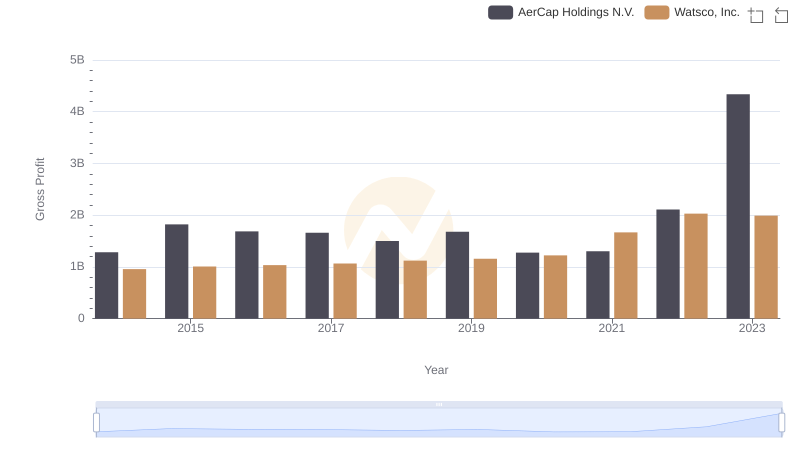
Gross Profit Comparison: Watsco, Inc. and AerCap Holdings N.V. Trends
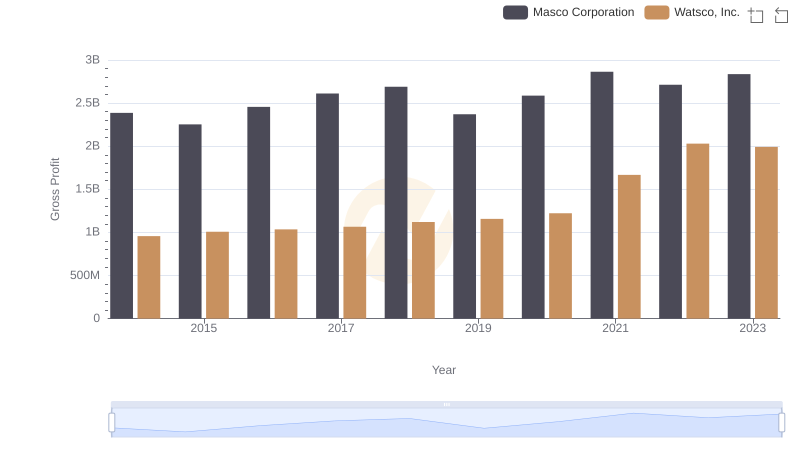
Gross Profit Trends Compared: Watsco, Inc. vs Masco Corporation
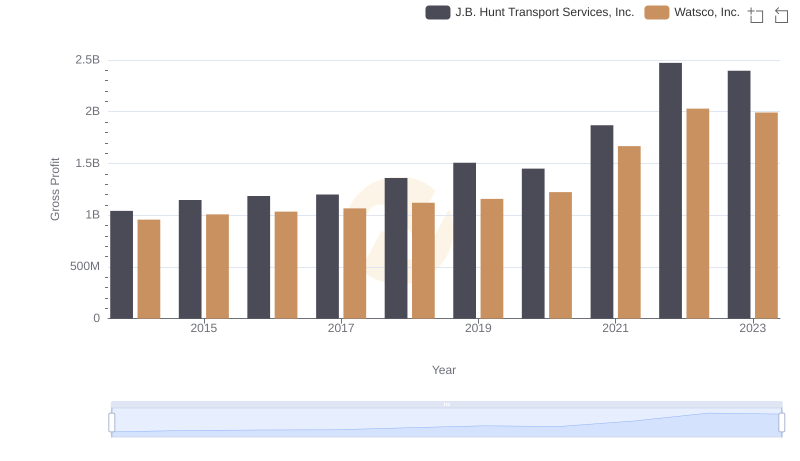
Key Insights on Gross Profit: Watsco, Inc. vs J.B. Hunt Transport Services, Inc.
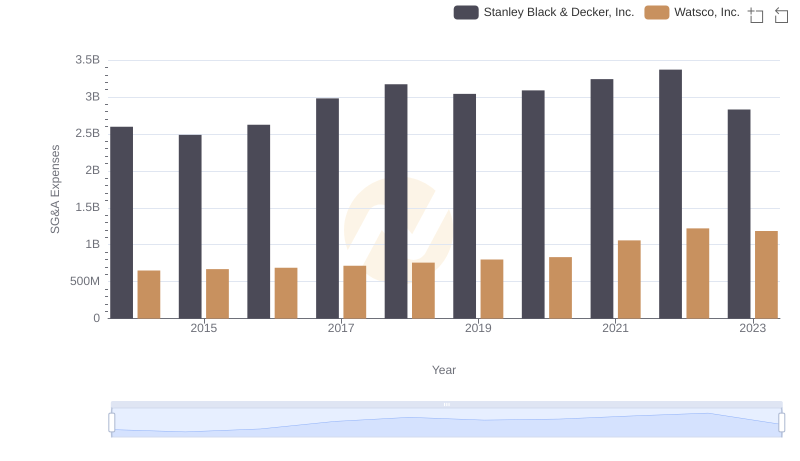
Breaking Down SG&A Expenses: Watsco, Inc. vs Stanley Black & Decker, Inc.
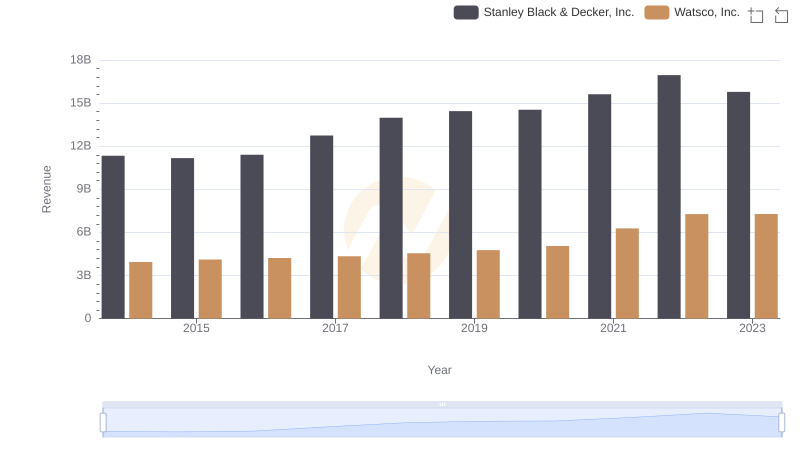
Who Generates More Revenue? Watsco, Inc. or Stanley Black & Decker, Inc.
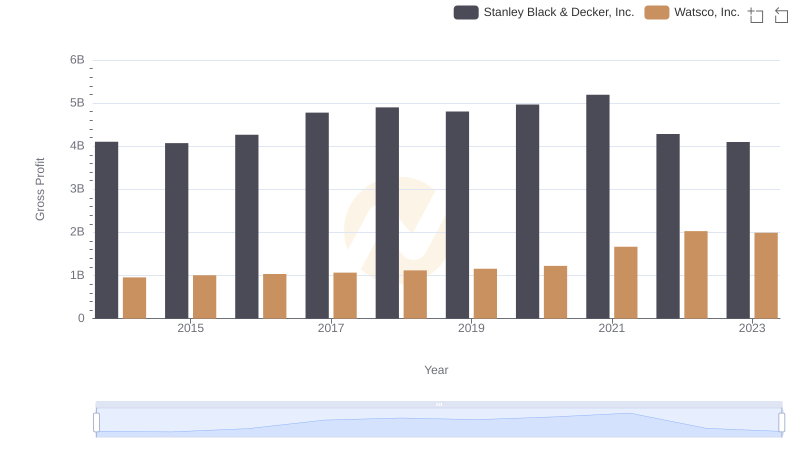
Gross Profit Trends Compared: Watsco, Inc. vs Stanley Black & Decker, Inc.

Cost Management Insights: SG&A Expenses for Watsco, Inc. and Stanley Black & Decker, Inc.
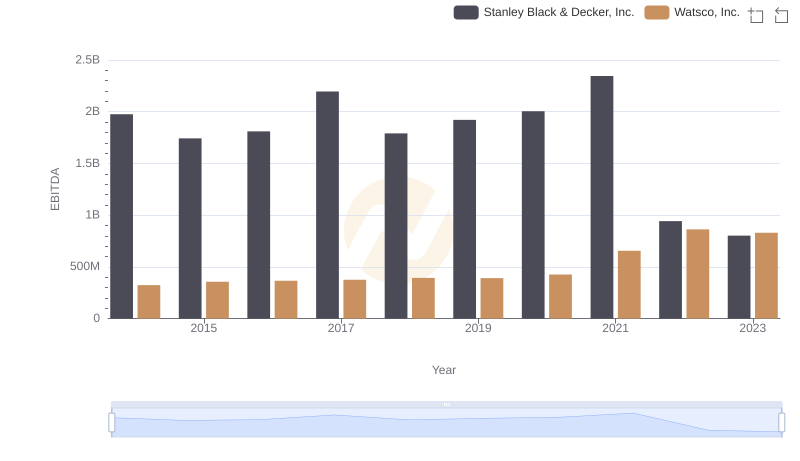
Comparative EBITDA Analysis: Watsco, Inc. vs Stanley Black & Decker, Inc.