| __timestamp | Jacobs Engineering Group Inc. | Watsco, Inc. |
|---|---|---|
| Wednesday, January 1, 2014 | 2073784000 | 956402000 |
| Thursday, January 1, 2015 | 1968338000 | 1007357000 |
| Friday, January 1, 2016 | 1767831000 | 1034584000 |
| Sunday, January 1, 2017 | 1772252000 | 1065659000 |
| Monday, January 1, 2018 | 2828370000 | 1120252000 |
| Tuesday, January 1, 2019 | 2477028000 | 1156956000 |
| Wednesday, January 1, 2020 | 2586668000 | 1222821000 |
| Friday, January 1, 2021 | 3043772000 | 1667545000 |
| Saturday, January 1, 2022 | 3327040000 | 2030289000 |
| Sunday, January 1, 2023 | 3473315000 | 1992140000 |
| Monday, January 1, 2024 | 2832756000 | 2044713000 |
Igniting the spark of knowledge
In the competitive landscape of engineering and distribution, Jacobs Engineering Group Inc. and Watsco, Inc. have showcased intriguing financial trajectories over the past decade. From 2014 to 2023, Jacobs Engineering consistently outperformed Watsco in terms of gross profit, peaking in 2023 with a remarkable 35% increase from its 2014 figures. Meanwhile, Watsco demonstrated steady growth, achieving a 108% rise in gross profit by 2022 compared to 2014. However, data for 2024 remains incomplete, leaving room for speculation on future trends. This analysis highlights the resilience and strategic prowess of these industry leaders, offering valuable insights for investors and stakeholders alike.
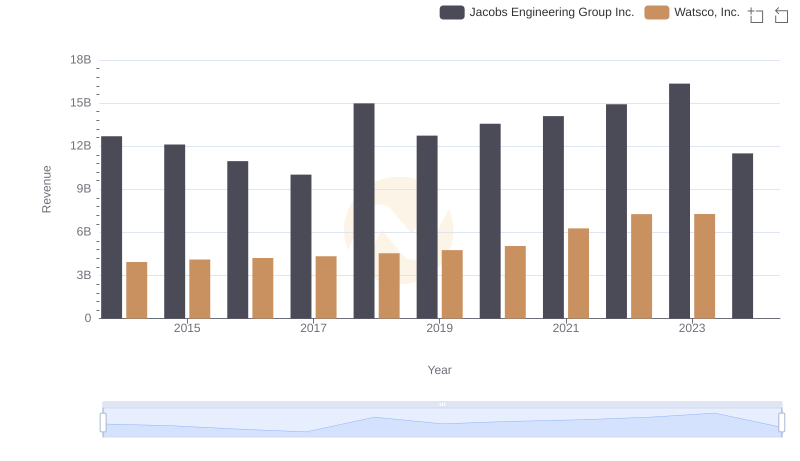
Breaking Down Revenue Trends: Watsco, Inc. vs Jacobs Engineering Group Inc.
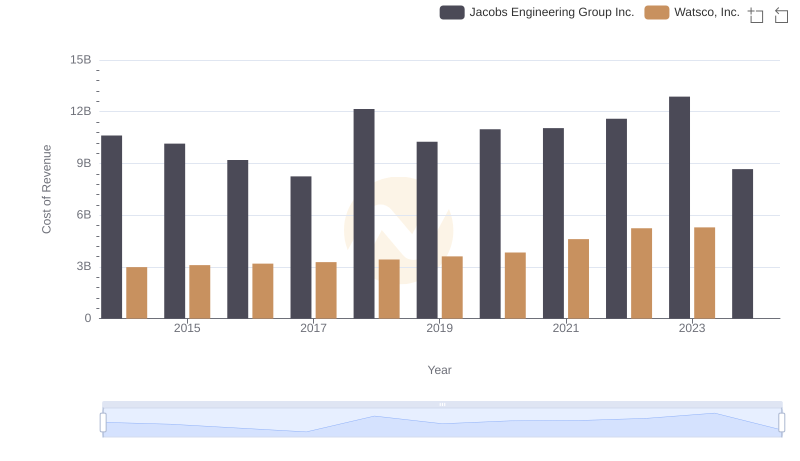
Cost of Revenue: Key Insights for Watsco, Inc. and Jacobs Engineering Group Inc.
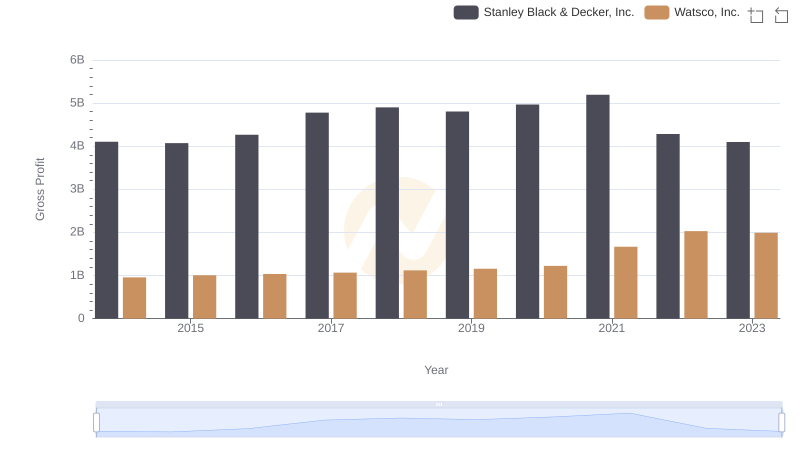
Key Insights on Gross Profit: Watsco, Inc. vs Stanley Black & Decker, Inc.
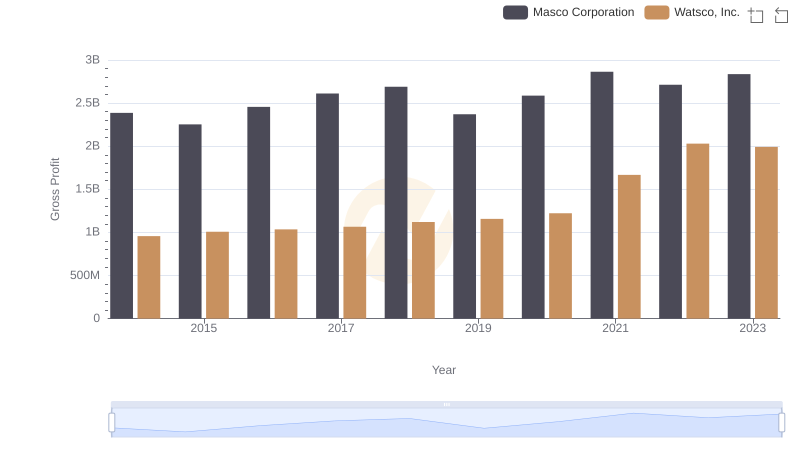
Gross Profit Trends Compared: Watsco, Inc. vs Masco Corporation
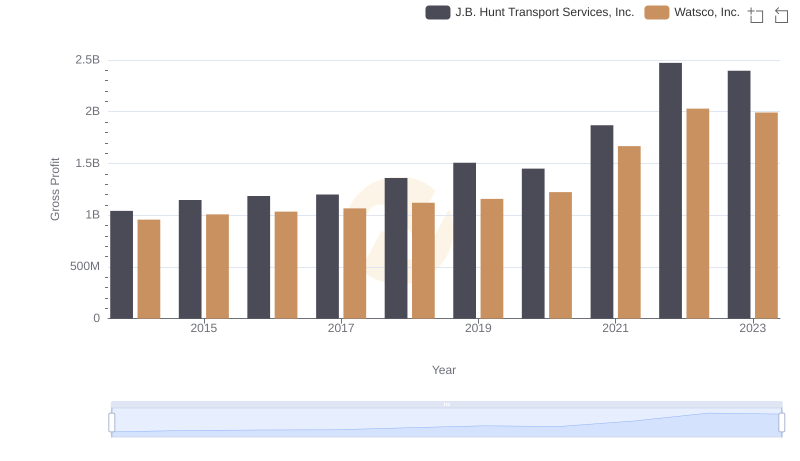
Key Insights on Gross Profit: Watsco, Inc. vs J.B. Hunt Transport Services, Inc.
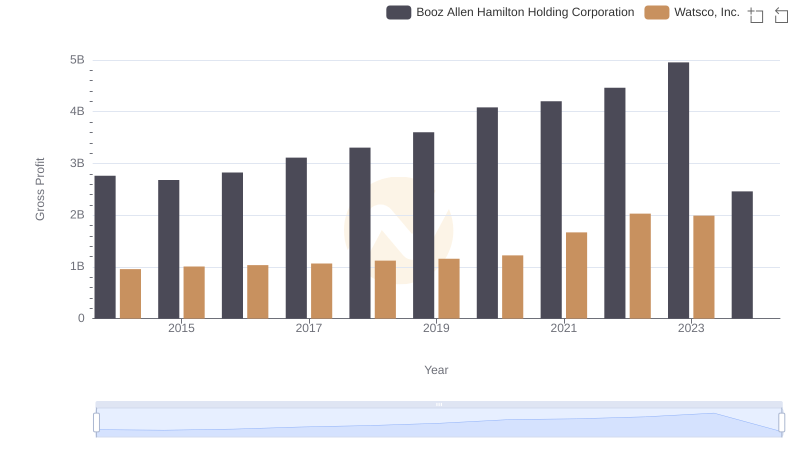
Who Generates Higher Gross Profit? Watsco, Inc. or Booz Allen Hamilton Holding Corporation
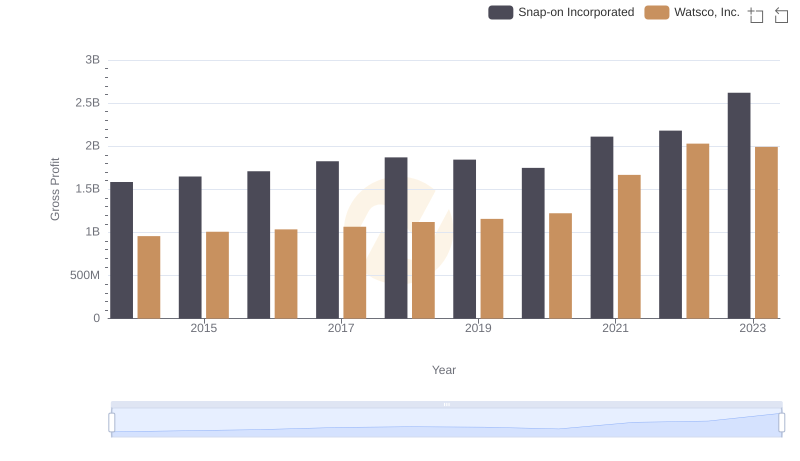
Gross Profit Comparison: Watsco, Inc. and Snap-on Incorporated Trends
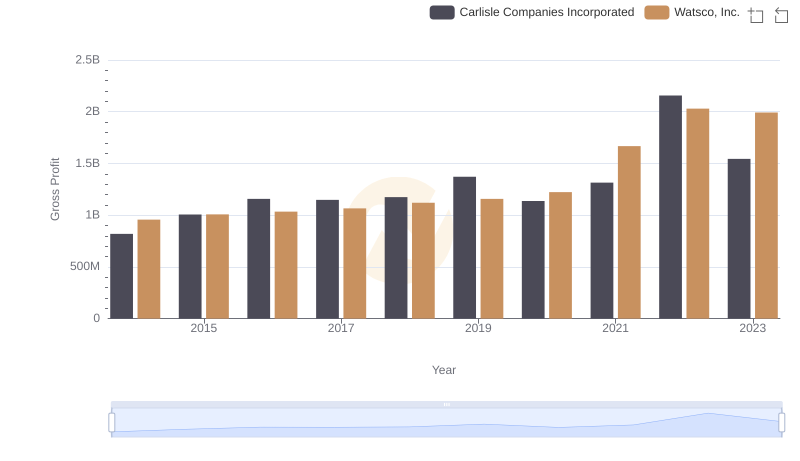
Key Insights on Gross Profit: Watsco, Inc. vs Carlisle Companies Incorporated
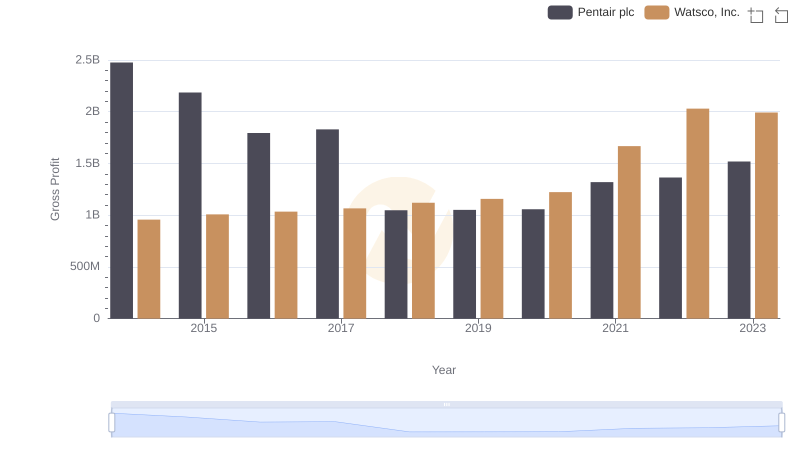
Gross Profit Comparison: Watsco, Inc. and Pentair plc Trends
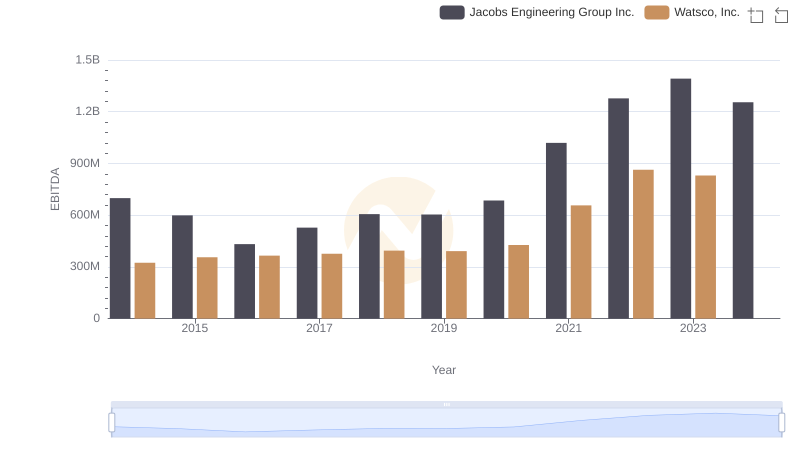
Professional EBITDA Benchmarking: Watsco, Inc. vs Jacobs Engineering Group Inc.