| __timestamp | AerCap Holdings N.V. | Watsco, Inc. |
|---|---|---|
| Wednesday, January 1, 2014 | 1282919000 | 956402000 |
| Thursday, January 1, 2015 | 1822255000 | 1007357000 |
| Friday, January 1, 2016 | 1686404000 | 1034584000 |
| Sunday, January 1, 2017 | 1660054000 | 1065659000 |
| Monday, January 1, 2018 | 1500345000 | 1120252000 |
| Tuesday, January 1, 2019 | 1678249000 | 1156956000 |
| Wednesday, January 1, 2020 | 1276496000 | 1222821000 |
| Friday, January 1, 2021 | 1301517000 | 1667545000 |
| Saturday, January 1, 2022 | 2109708000 | 2030289000 |
| Sunday, January 1, 2023 | 4337648000 | 1992140000 |
| Monday, January 1, 2024 | 2044713000 |
Unlocking the unknown
In the ever-evolving landscape of global business, Watsco, Inc. and AerCap Holdings N.V. have emerged as formidable players in their respective industries. Over the past decade, these companies have demonstrated remarkable resilience and growth, as evidenced by their gross profit trends from 2014 to 2023.
AerCap Holdings N.V., a leader in aircraft leasing, has seen its gross profit soar by over 238% from 2014 to 2023, peaking in 2023 with a staggering 4.34 billion. This growth reflects the company's strategic acquisitions and expanding global footprint.
Meanwhile, Watsco, Inc., a major distributor of HVAC/R products, has consistently increased its gross profit by approximately 108% over the same period, reaching a high of 2.03 billion in 2022. This steady rise underscores Watsco's robust market presence and commitment to innovation.
These trends highlight the dynamic nature of global commerce and the strategic maneuvers that drive success in diverse sectors.
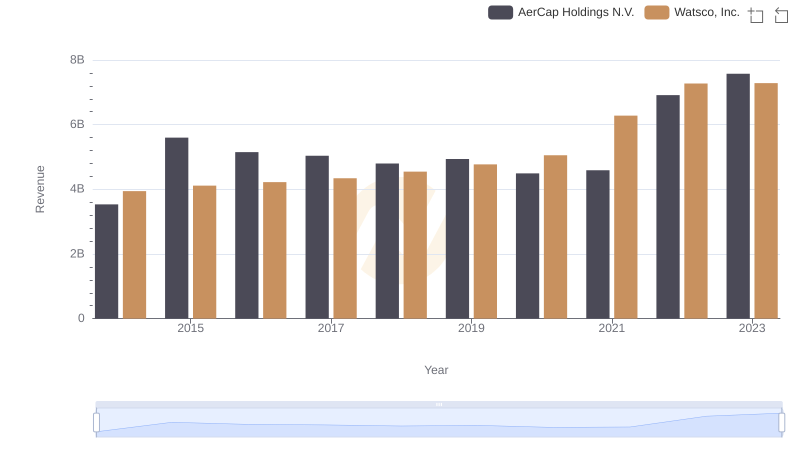
Watsco, Inc. vs AerCap Holdings N.V.: Examining Key Revenue Metrics
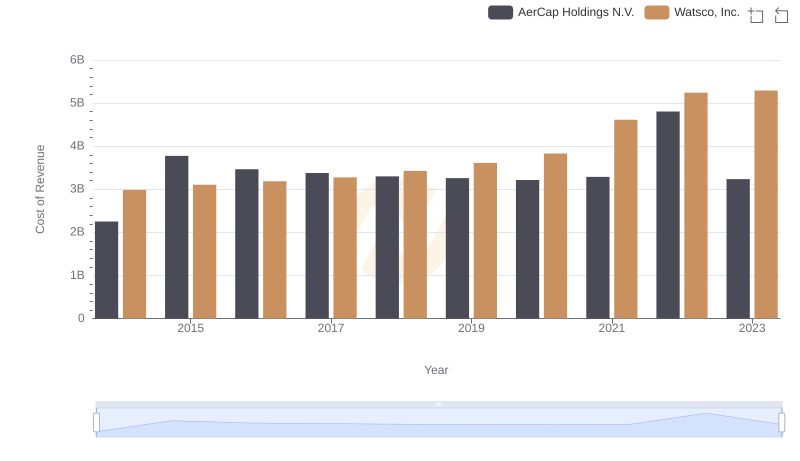
Cost of Revenue Comparison: Watsco, Inc. vs AerCap Holdings N.V.
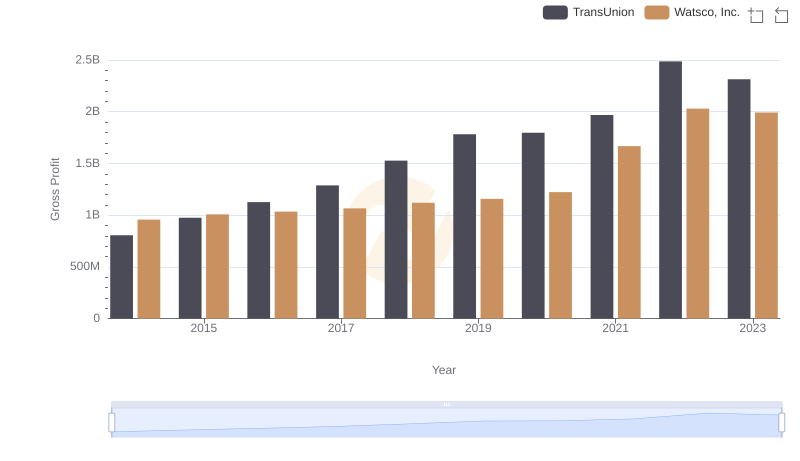
Gross Profit Comparison: Watsco, Inc. and TransUnion Trends
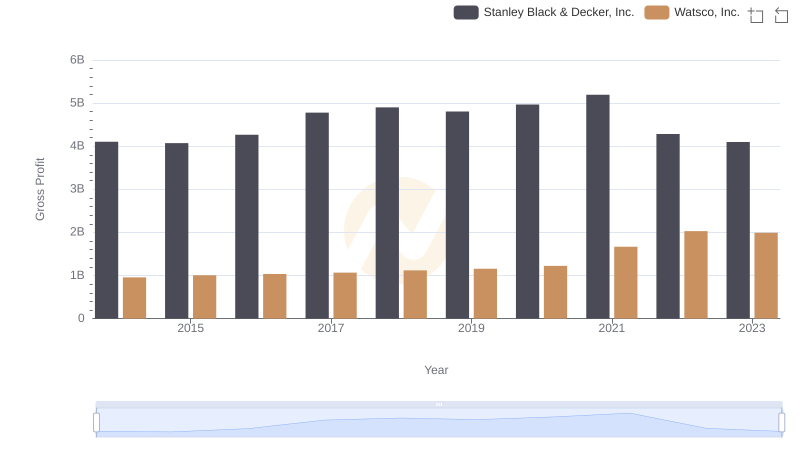
Key Insights on Gross Profit: Watsco, Inc. vs Stanley Black & Decker, Inc.
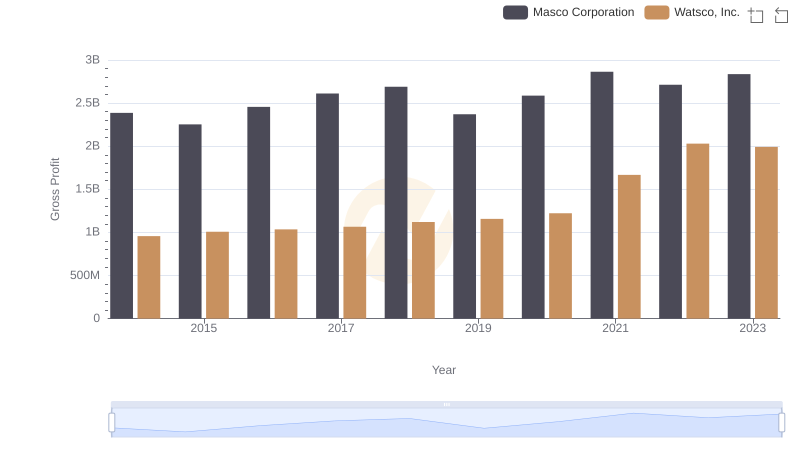
Gross Profit Trends Compared: Watsco, Inc. vs Masco Corporation
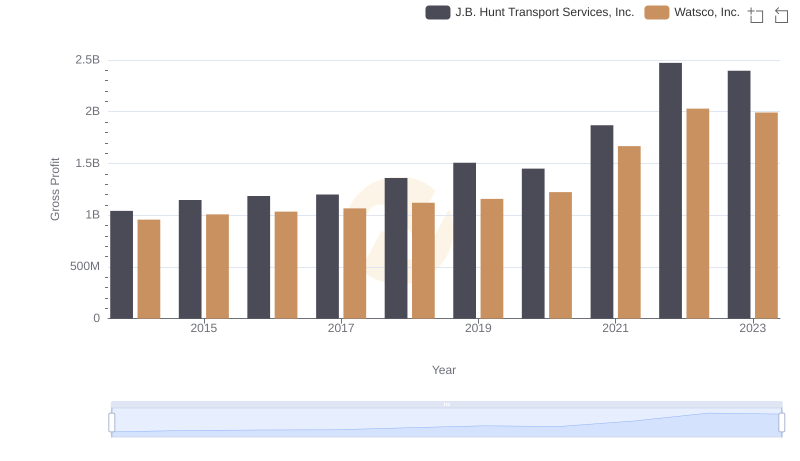
Key Insights on Gross Profit: Watsco, Inc. vs J.B. Hunt Transport Services, Inc.
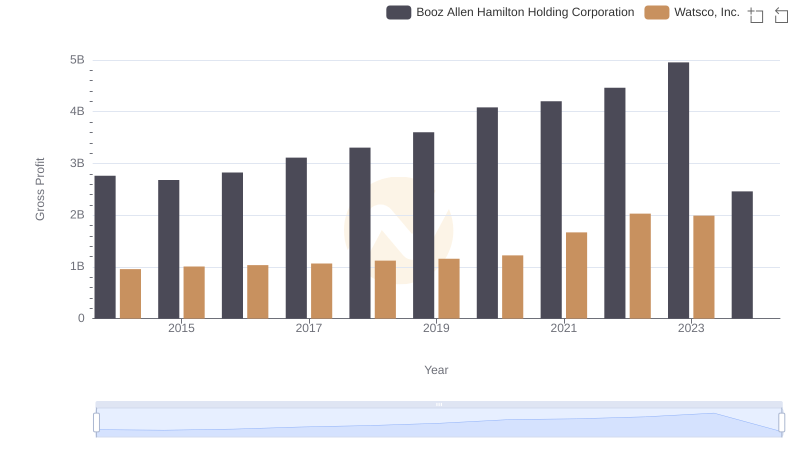
Who Generates Higher Gross Profit? Watsco, Inc. or Booz Allen Hamilton Holding Corporation
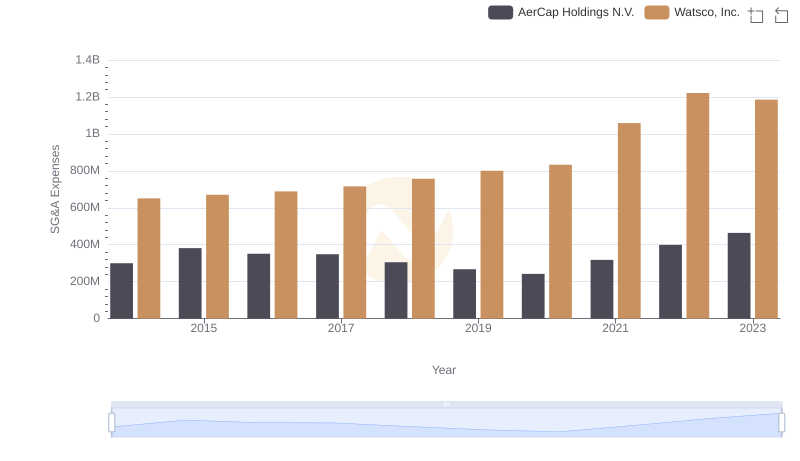
Breaking Down SG&A Expenses: Watsco, Inc. vs AerCap Holdings N.V.
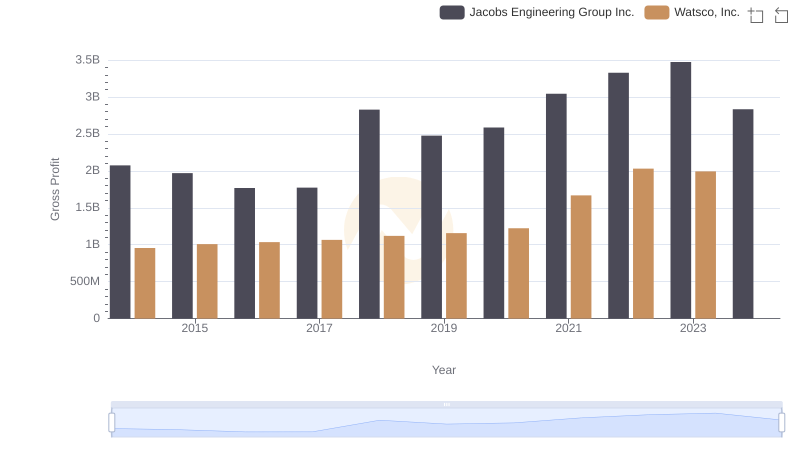
Key Insights on Gross Profit: Watsco, Inc. vs Jacobs Engineering Group Inc.
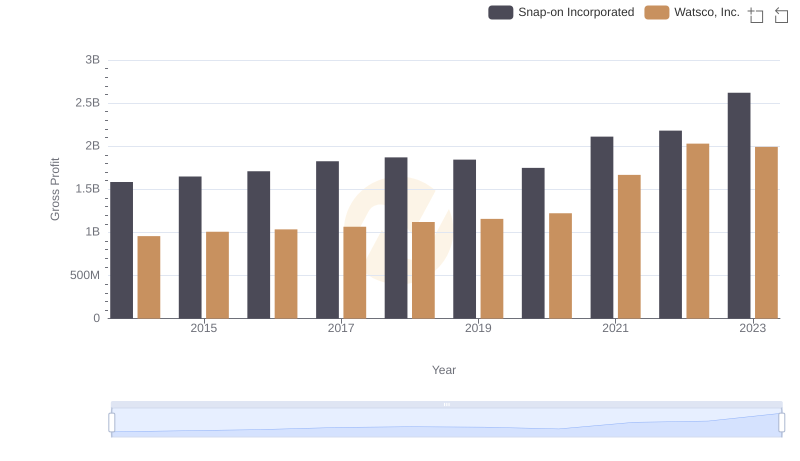
Gross Profit Comparison: Watsco, Inc. and Snap-on Incorporated Trends
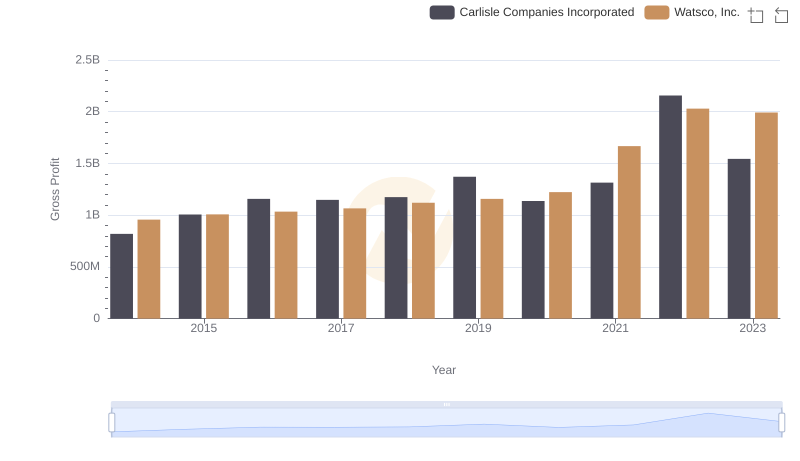
Key Insights on Gross Profit: Watsco, Inc. vs Carlisle Companies Incorporated