| __timestamp | AerCap Holdings N.V. | Trane Technologies plc |
|---|---|---|
| Wednesday, January 1, 2014 | 3535797000 | 12891400000 |
| Thursday, January 1, 2015 | 5598662000 | 13300700000 |
| Friday, January 1, 2016 | 5152131000 | 13508900000 |
| Sunday, January 1, 2017 | 5037493000 | 14197600000 |
| Monday, January 1, 2018 | 4799980000 | 15668200000 |
| Tuesday, January 1, 2019 | 4937340000 | 16598900000 |
| Wednesday, January 1, 2020 | 4493629000 | 12454700000 |
| Friday, January 1, 2021 | 4588930000 | 14136400000 |
| Saturday, January 1, 2022 | 6914985000 | 15991700000 |
| Sunday, January 1, 2023 | 7574664000 | 17677600000 |
| Monday, January 1, 2024 | 19838200000 |
Igniting the spark of knowledge
In the competitive landscape of global industries, Trane Technologies plc and AerCap Holdings N.V. have showcased remarkable revenue trajectories over the past decade. From 2014 to 2023, Trane Technologies plc has consistently outperformed AerCap Holdings N.V., with revenues peaking at approximately $17.7 billion in 2023, marking a 37% increase from 2014. Meanwhile, AerCap Holdings N.V. experienced a significant revenue surge, reaching around $7.6 billion in 2023, a notable 114% growth from its 2014 figures.
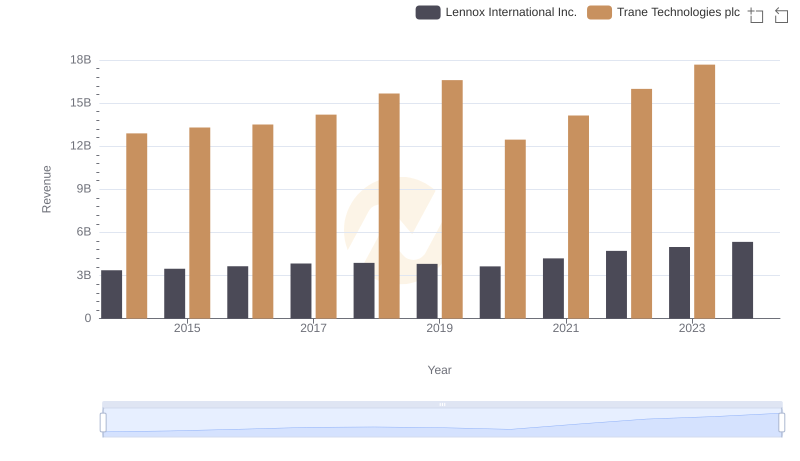
Trane Technologies plc vs Lennox International Inc.: Examining Key Revenue Metrics
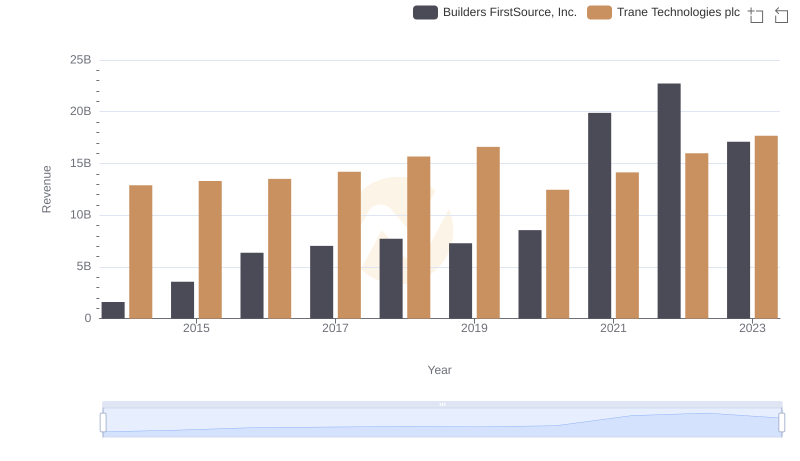
Trane Technologies plc vs Builders FirstSource, Inc.: Examining Key Revenue Metrics

Breaking Down Revenue Trends: Trane Technologies plc vs Hubbell Incorporated
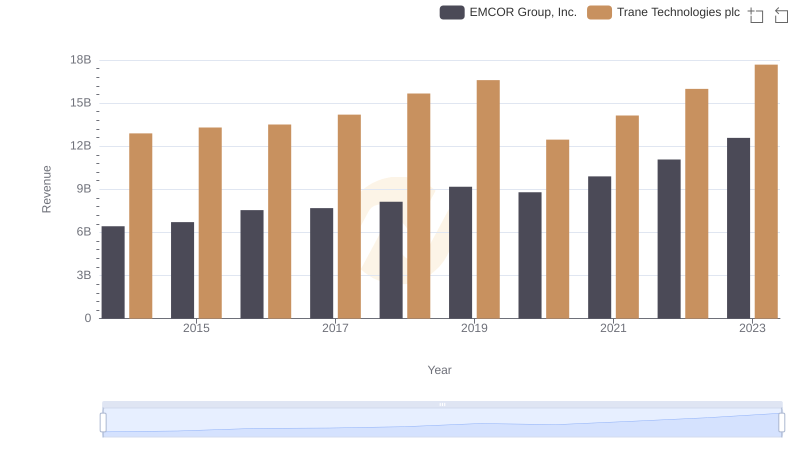
Trane Technologies plc and EMCOR Group, Inc.: A Comprehensive Revenue Analysis
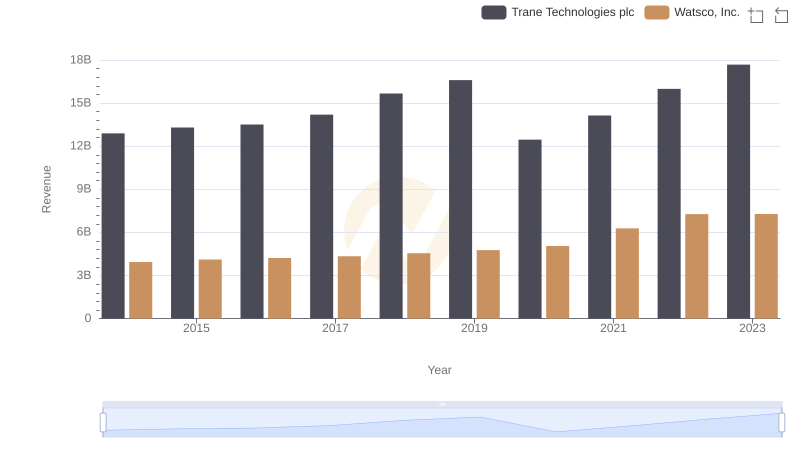
Trane Technologies plc or Watsco, Inc.: Who Leads in Yearly Revenue?
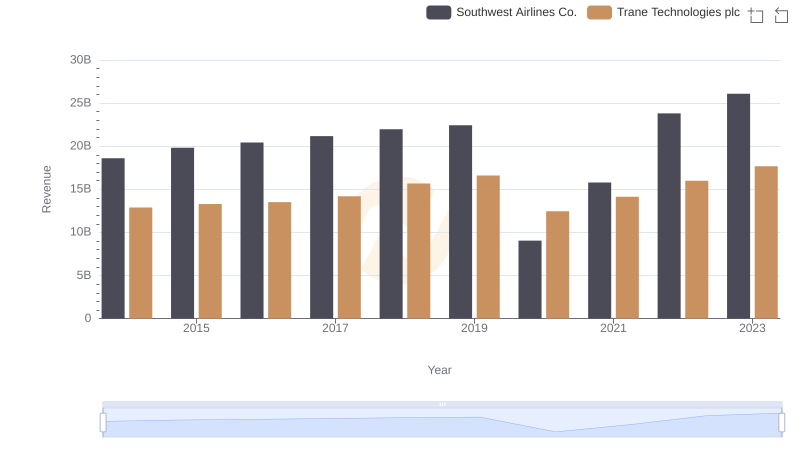
Comparing Revenue Performance: Trane Technologies plc or Southwest Airlines Co.?
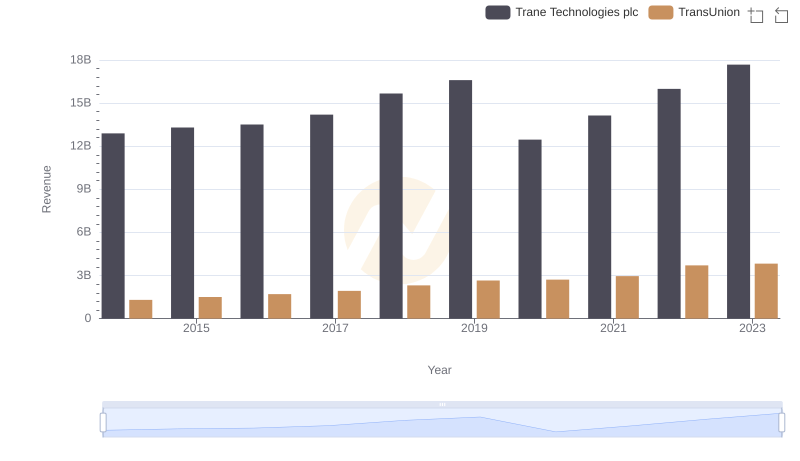
Revenue Insights: Trane Technologies plc and TransUnion Performance Compared
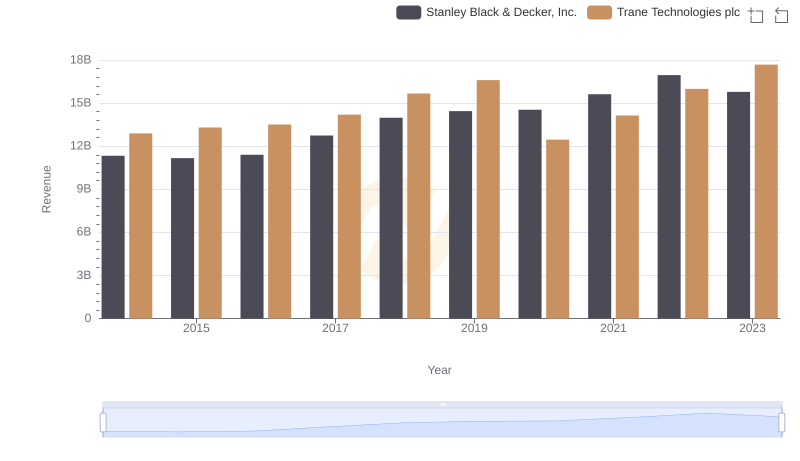
Trane Technologies plc or Stanley Black & Decker, Inc.: Who Leads in Yearly Revenue?
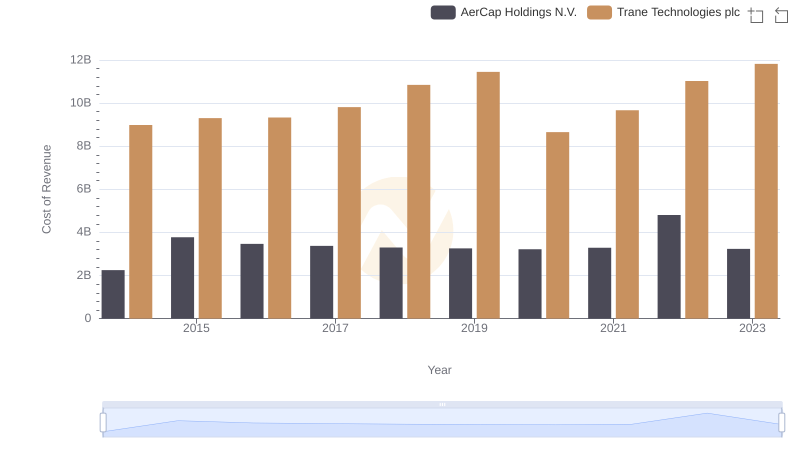
Trane Technologies plc vs AerCap Holdings N.V.: Efficiency in Cost of Revenue Explored
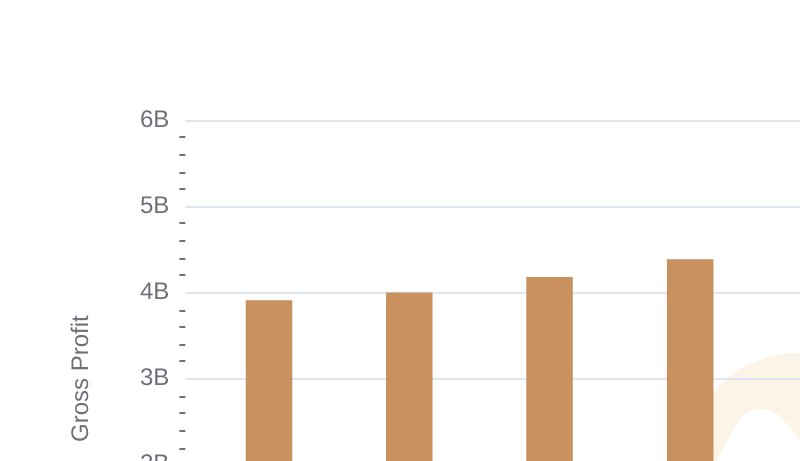
Gross Profit Trends Compared: Trane Technologies plc vs AerCap Holdings N.V.
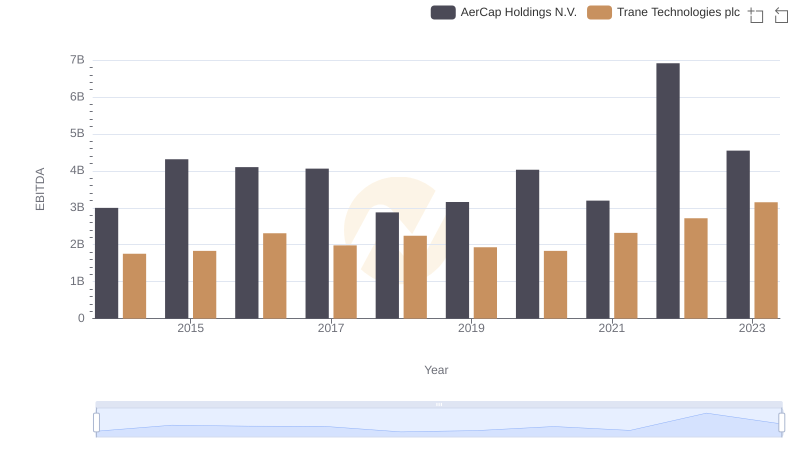
Comprehensive EBITDA Comparison: Trane Technologies plc vs AerCap Holdings N.V.