| __timestamp | AerCap Holdings N.V. | Trane Technologies plc |
|---|---|---|
| Wednesday, January 1, 2014 | 2997442000 | 1757000000 |
| Thursday, January 1, 2015 | 4313510000 | 1835000000 |
| Friday, January 1, 2016 | 4101801000 | 2311000000 |
| Sunday, January 1, 2017 | 4061381000 | 1982500000 |
| Monday, January 1, 2018 | 2874193000 | 2242400000 |
| Tuesday, January 1, 2019 | 3157061000 | 1931200000 |
| Wednesday, January 1, 2020 | 4028661000 | 1831900000 |
| Friday, January 1, 2021 | 3192341000 | 2319200000 |
| Saturday, January 1, 2022 | 6911148000 | 2715500000 |
| Sunday, January 1, 2023 | 4547656000 | 3149900000 |
| Monday, January 1, 2024 | 3859600000 |
Cracking the code
In the ever-evolving landscape of global business, understanding the financial health of industry giants is crucial. This analysis delves into the EBITDA performance of Trane Technologies plc and AerCap Holdings N.V. from 2014 to 2023. Over this period, AerCap Holdings consistently outperformed Trane Technologies, with an average EBITDA approximately 82% higher. Notably, AerCap's EBITDA peaked in 2022, surging by 138% compared to its 2018 low, reflecting strategic growth and market adaptation. Meanwhile, Trane Technologies demonstrated steady growth, culminating in a 79% increase in EBITDA from 2014 to 2023. This comparison highlights the resilience and strategic prowess of these companies in navigating economic fluctuations. As we look to the future, these insights offer a window into the financial strategies that drive success in the competitive global market.
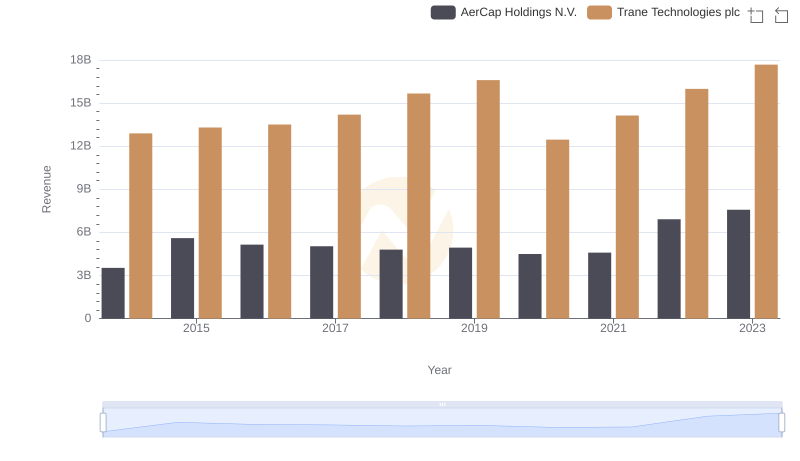
Revenue Insights: Trane Technologies plc and AerCap Holdings N.V. Performance Compared
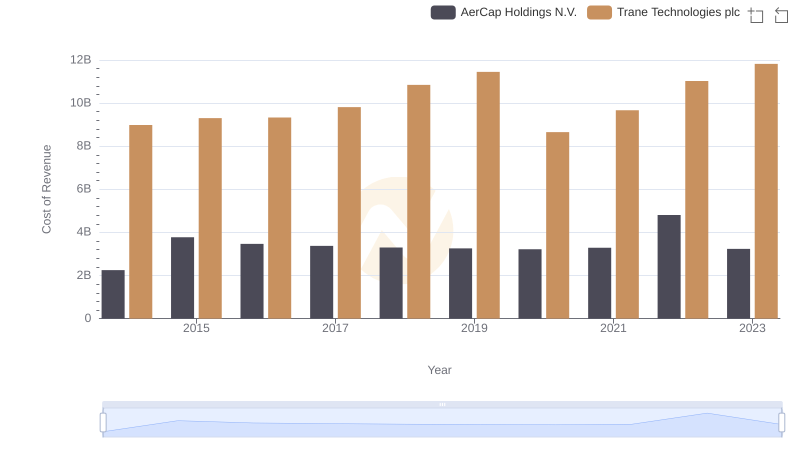
Trane Technologies plc vs AerCap Holdings N.V.: Efficiency in Cost of Revenue Explored
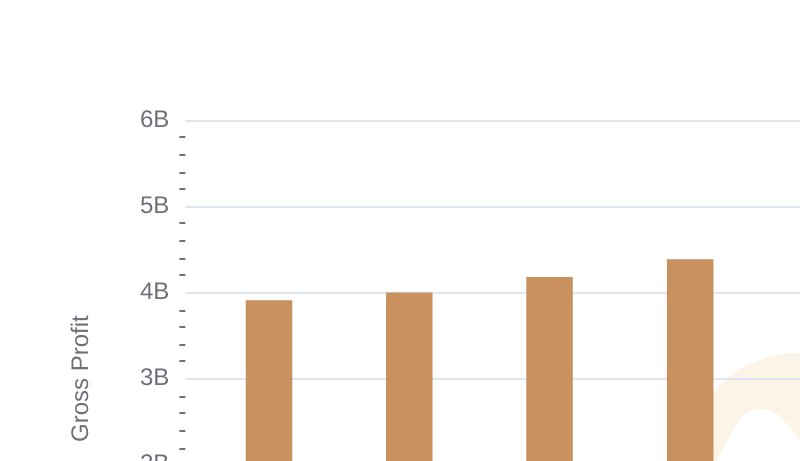
Gross Profit Trends Compared: Trane Technologies plc vs AerCap Holdings N.V.
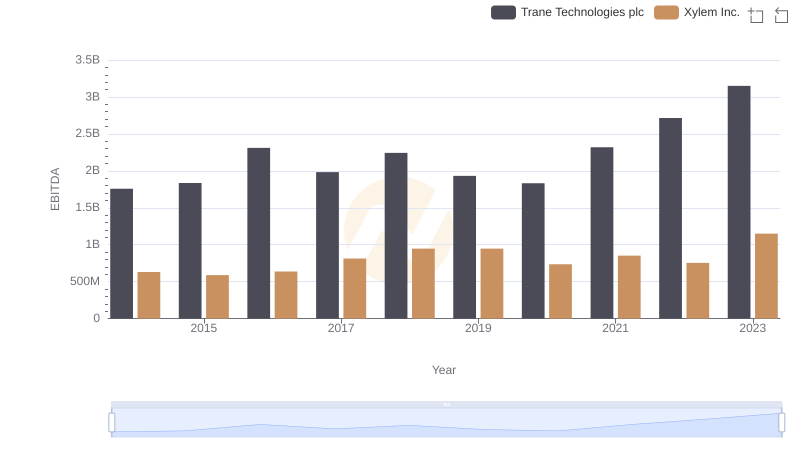
A Professional Review of EBITDA: Trane Technologies plc Compared to Xylem Inc.
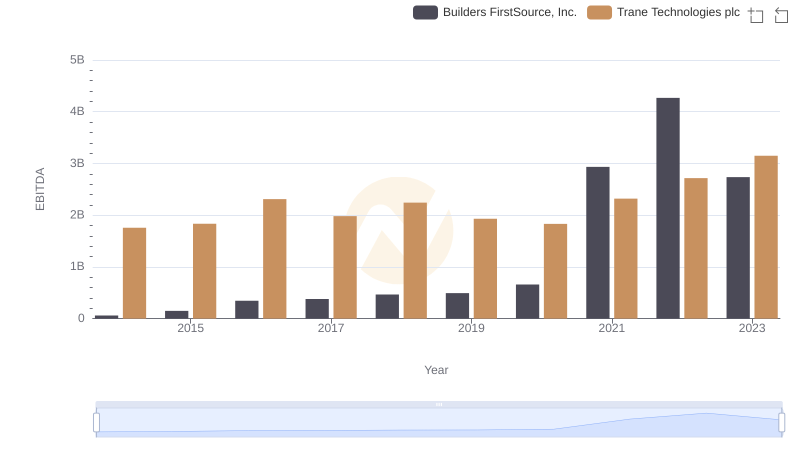
EBITDA Metrics Evaluated: Trane Technologies plc vs Builders FirstSource, Inc.
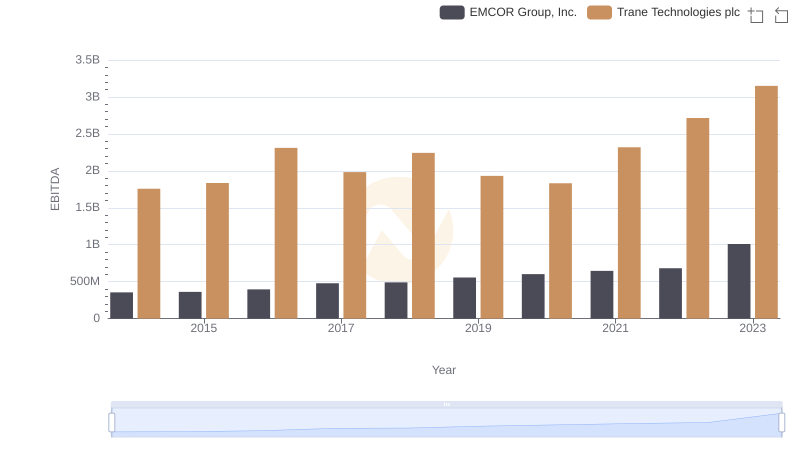
A Professional Review of EBITDA: Trane Technologies plc Compared to EMCOR Group, Inc.
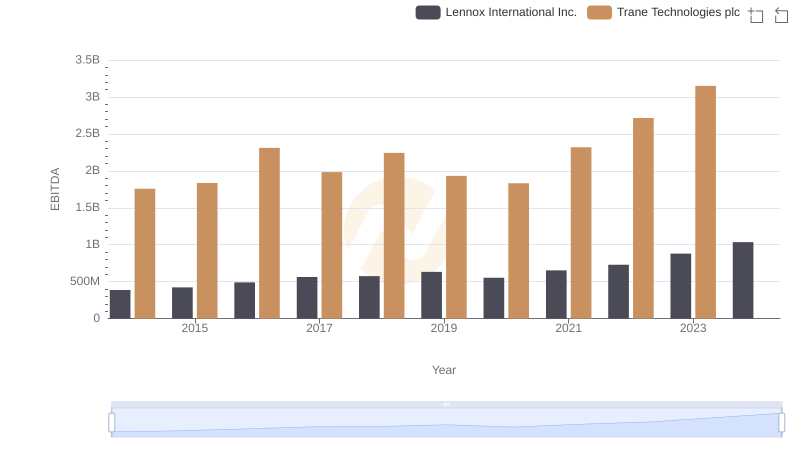
EBITDA Analysis: Evaluating Trane Technologies plc Against Lennox International Inc.
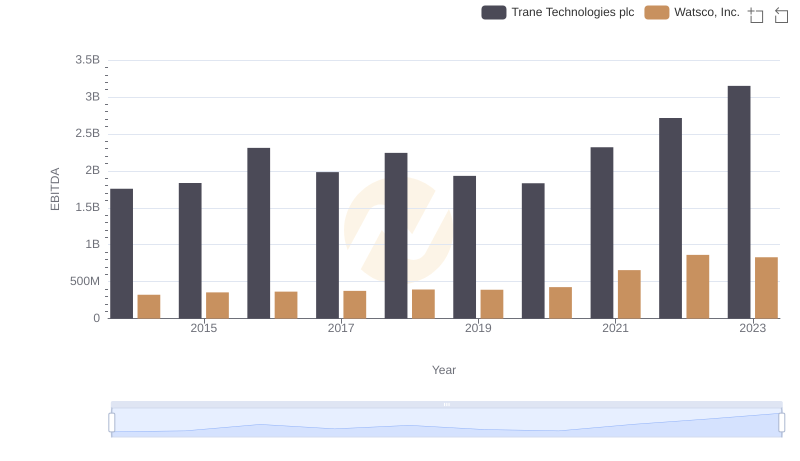
EBITDA Metrics Evaluated: Trane Technologies plc vs Watsco, Inc.
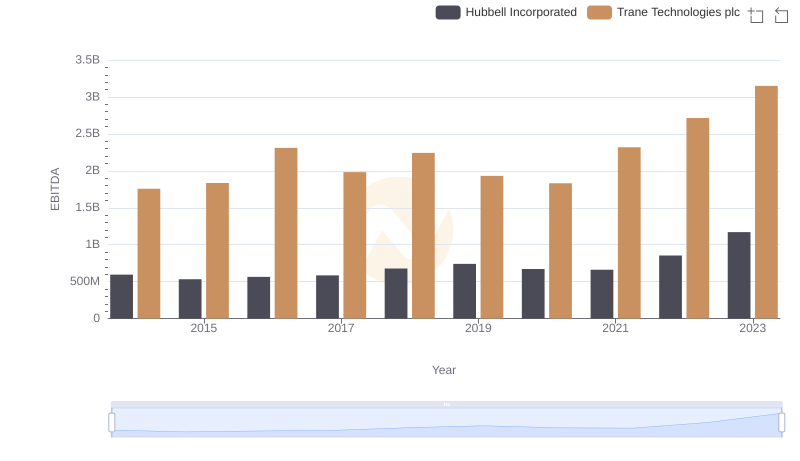
Trane Technologies plc and Hubbell Incorporated: A Detailed Examination of EBITDA Performance

Trane Technologies plc vs TransUnion: In-Depth EBITDA Performance Comparison
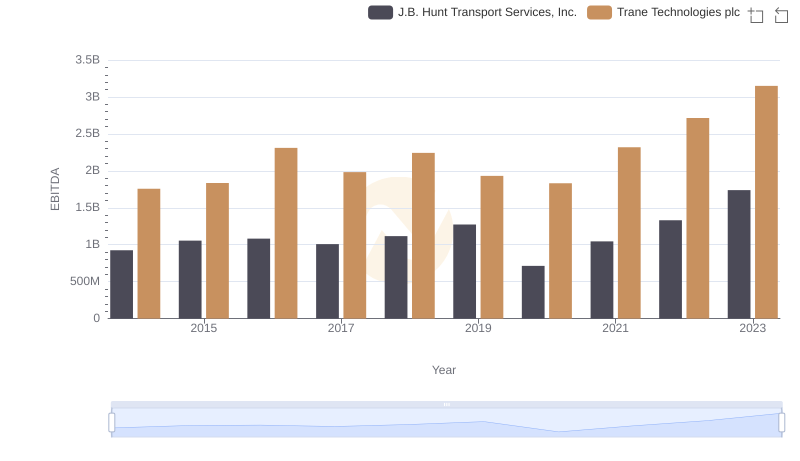
EBITDA Metrics Evaluated: Trane Technologies plc vs J.B. Hunt Transport Services, Inc.