| __timestamp | AerCap Holdings N.V. | Trane Technologies plc |
|---|---|---|
| Wednesday, January 1, 2014 | 2252878000 | 8982800000 |
| Thursday, January 1, 2015 | 3776407000 | 9301600000 |
| Friday, January 1, 2016 | 3465727000 | 9329300000 |
| Sunday, January 1, 2017 | 3377439000 | 9811600000 |
| Monday, January 1, 2018 | 3299635000 | 10847600000 |
| Tuesday, January 1, 2019 | 3259091000 | 11451500000 |
| Wednesday, January 1, 2020 | 3217133000 | 8651300000 |
| Friday, January 1, 2021 | 3287413000 | 9666800000 |
| Saturday, January 1, 2022 | 4805277000 | 11026900000 |
| Sunday, January 1, 2023 | 3237016000 | 11820400000 |
| Monday, January 1, 2024 | 12757700000 |
Infusing magic into the data realm
In the ever-evolving landscape of global business, cost efficiency remains a pivotal factor for success. This analysis delves into the cost of revenue trends for Trane Technologies plc and AerCap Holdings N.V. from 2014 to 2023. Over this period, Trane Technologies consistently demonstrated a higher cost of revenue, peaking at approximately $11.8 billion in 2023, reflecting its expansive operations and market reach. In contrast, AerCap Holdings maintained a more streamlined cost structure, with its highest cost of revenue reaching around $4.8 billion in 2022.
Understanding these trends offers valuable insights into the operational strategies and market dynamics of these industry giants.
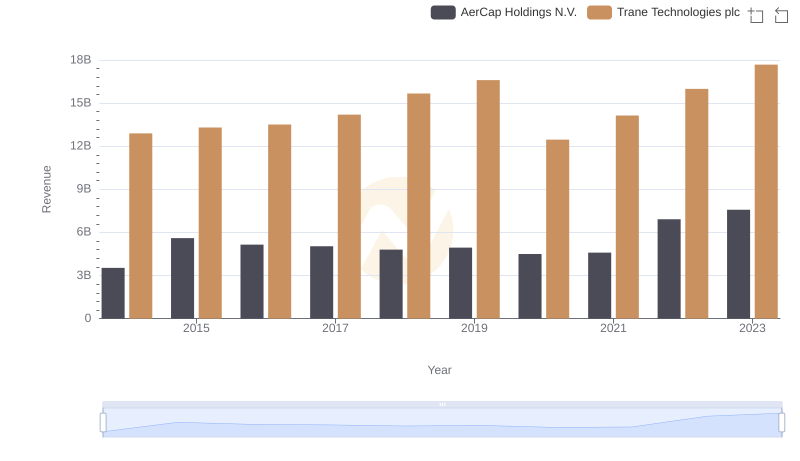
Revenue Insights: Trane Technologies plc and AerCap Holdings N.V. Performance Compared
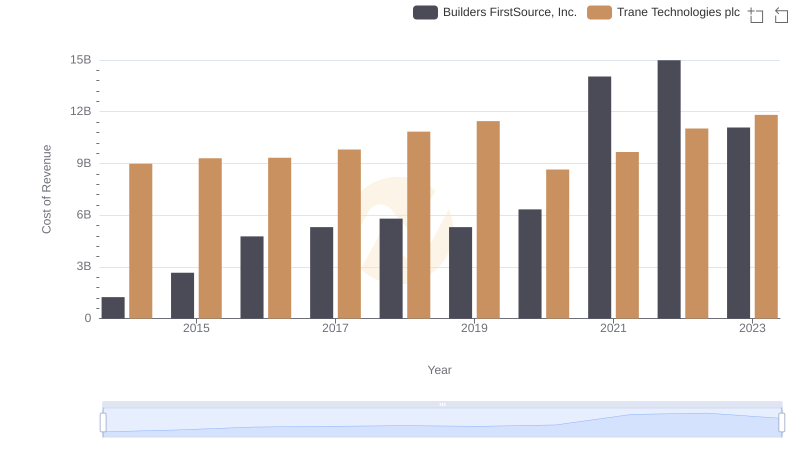
Cost of Revenue: Key Insights for Trane Technologies plc and Builders FirstSource, Inc.
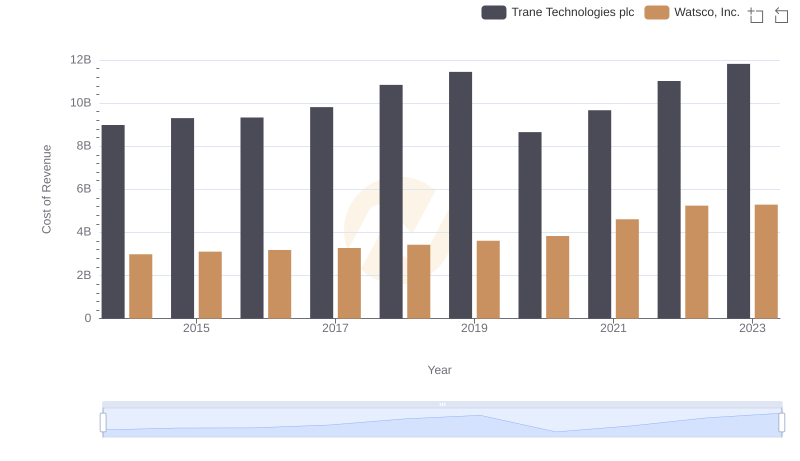
Cost of Revenue Trends: Trane Technologies plc vs Watsco, Inc.
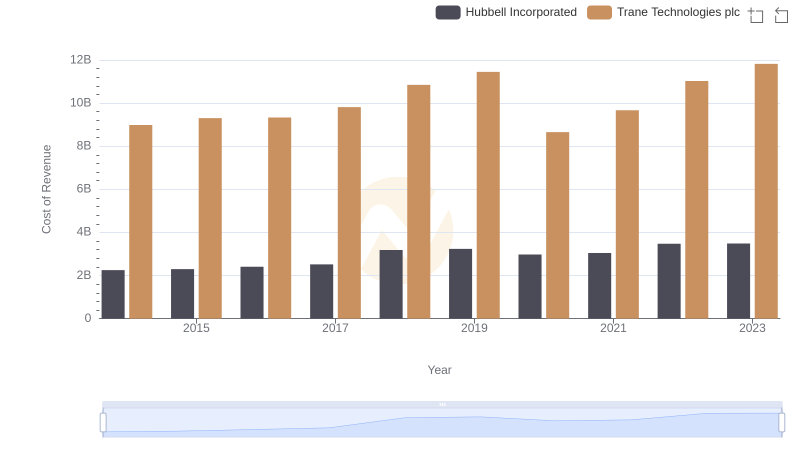
Analyzing Cost of Revenue: Trane Technologies plc and Hubbell Incorporated
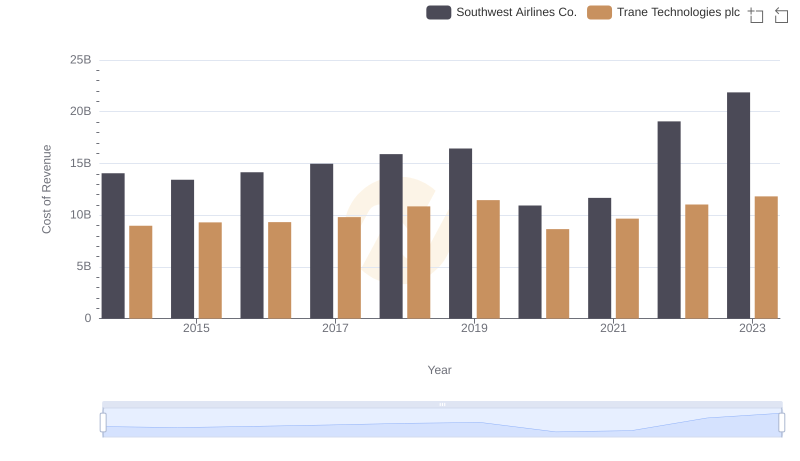
Analyzing Cost of Revenue: Trane Technologies plc and Southwest Airlines Co.
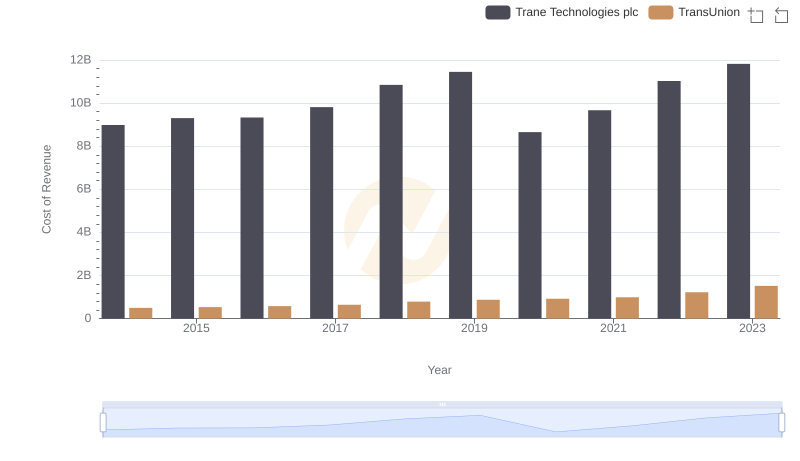
Cost of Revenue Comparison: Trane Technologies plc vs TransUnion
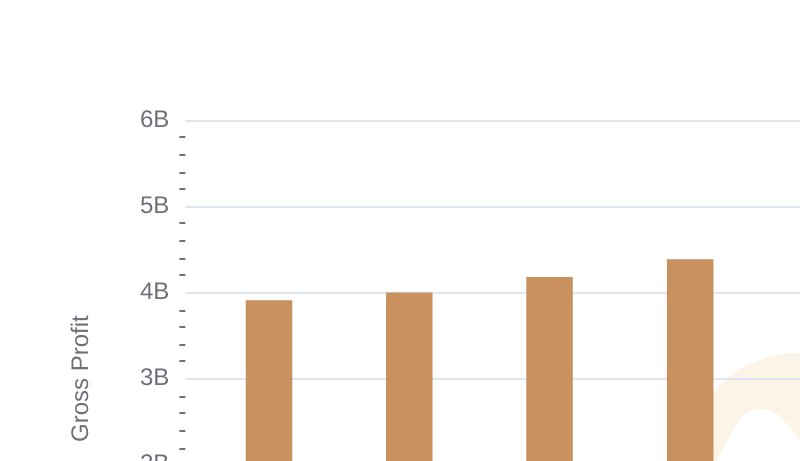
Gross Profit Trends Compared: Trane Technologies plc vs AerCap Holdings N.V.
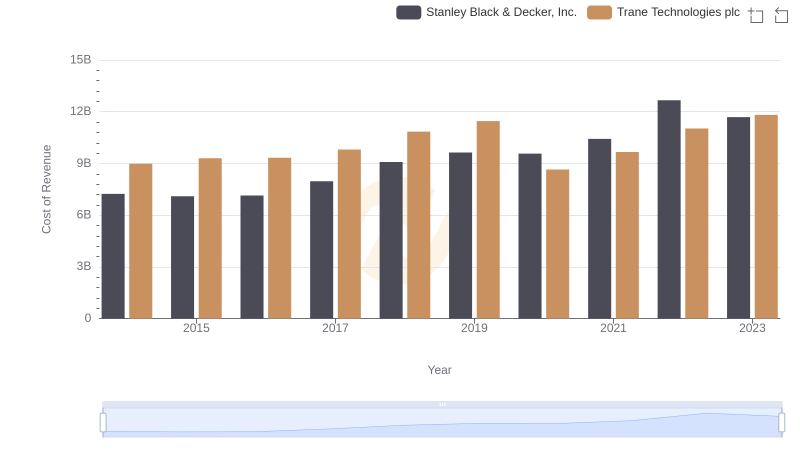
Cost of Revenue Trends: Trane Technologies plc vs Stanley Black & Decker, Inc.
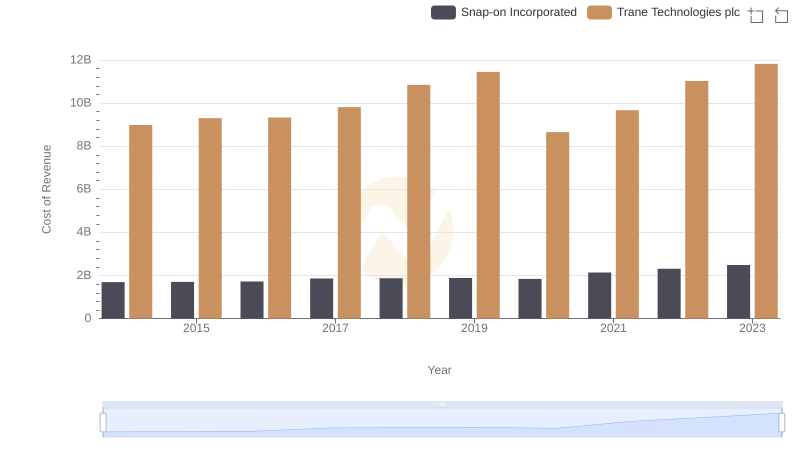
Cost Insights: Breaking Down Trane Technologies plc and Snap-on Incorporated's Expenses
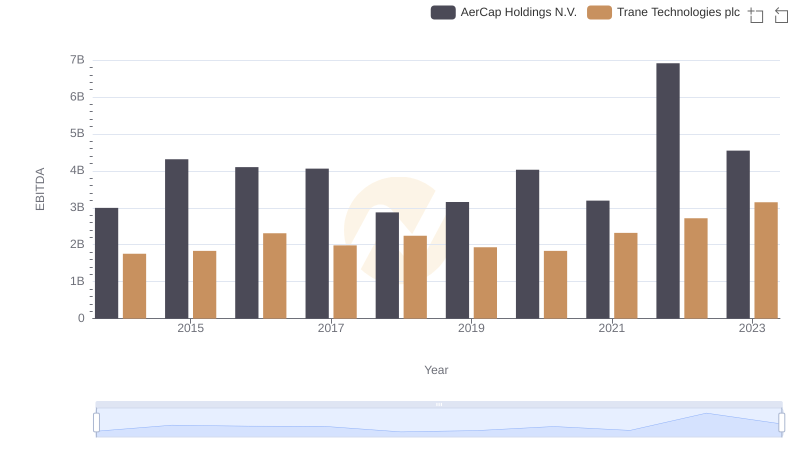
Comprehensive EBITDA Comparison: Trane Technologies plc vs AerCap Holdings N.V.