| __timestamp | Booz Allen Hamilton Holding Corporation | Rockwell Automation, Inc. |
|---|---|---|
| Wednesday, January 1, 2014 | 2762580000 | 2753900000 |
| Thursday, January 1, 2015 | 2680921000 | 2703100000 |
| Friday, January 1, 2016 | 2825712000 | 2475500000 |
| Sunday, January 1, 2017 | 3112302000 | 2624200000 |
| Monday, January 1, 2018 | 3304750000 | 2872200000 |
| Tuesday, January 1, 2019 | 3603571000 | 2900100000 |
| Wednesday, January 1, 2020 | 4084661000 | 2595200000 |
| Friday, January 1, 2021 | 4201408000 | 2897700000 |
| Saturday, January 1, 2022 | 4464078000 | 3102000000 |
| Sunday, January 1, 2023 | 4954101000 | 3717000000 |
| Monday, January 1, 2024 | 2459049000 | 3193400000 |
In pursuit of knowledge
In the competitive landscape of industrial automation and consulting, Rockwell Automation, Inc. and Booz Allen Hamilton Holding Corporation have showcased intriguing gross profit trends over the past decade. From 2014 to 2023, Booz Allen Hamilton's gross profit surged by approximately 79%, peaking in 2023. In contrast, Rockwell Automation experienced a more modest growth of around 35% during the same period.
Booz Allen Hamilton's gross profit consistently outpaced Rockwell Automation's, with a notable spike in 2023, reaching nearly 5 billion. However, 2024 saw a dramatic drop, highlighting potential market volatility or strategic shifts. Meanwhile, Rockwell Automation's steady climb culminated in a 2023 peak, suggesting resilience and strategic growth.
These trends underscore the dynamic nature of these industries, where strategic decisions and market conditions can significantly impact financial outcomes. Investors and industry watchers should consider these patterns when evaluating future prospects.
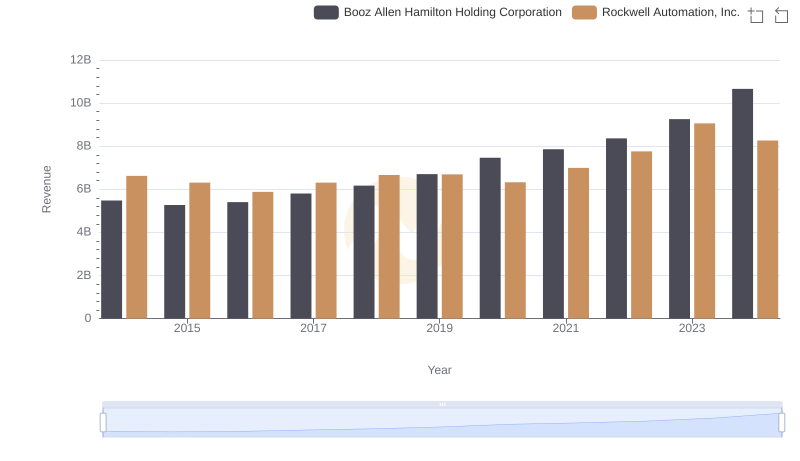
Breaking Down Revenue Trends: Rockwell Automation, Inc. vs Booz Allen Hamilton Holding Corporation
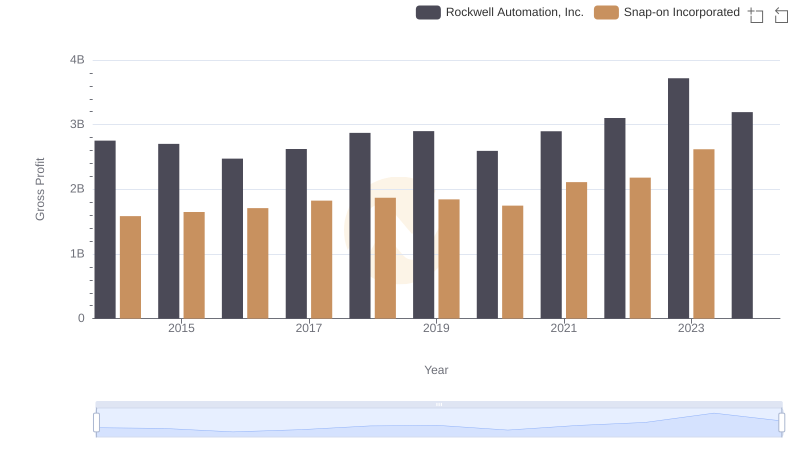
Who Generates Higher Gross Profit? Rockwell Automation, Inc. or Snap-on Incorporated
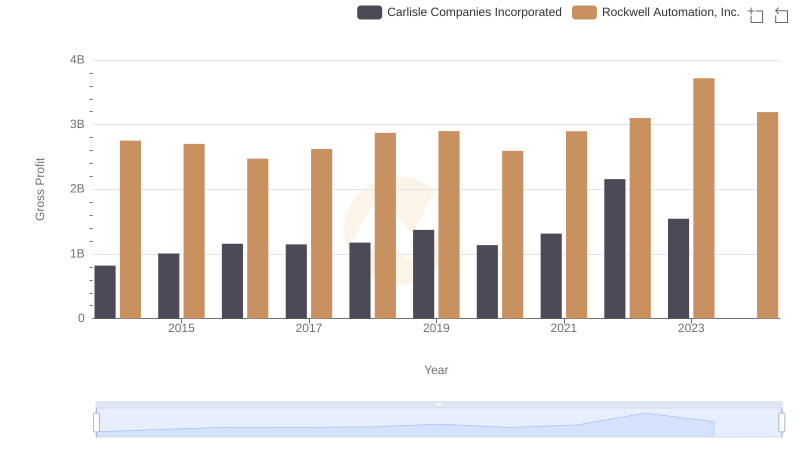
Gross Profit Analysis: Comparing Rockwell Automation, Inc. and Carlisle Companies Incorporated
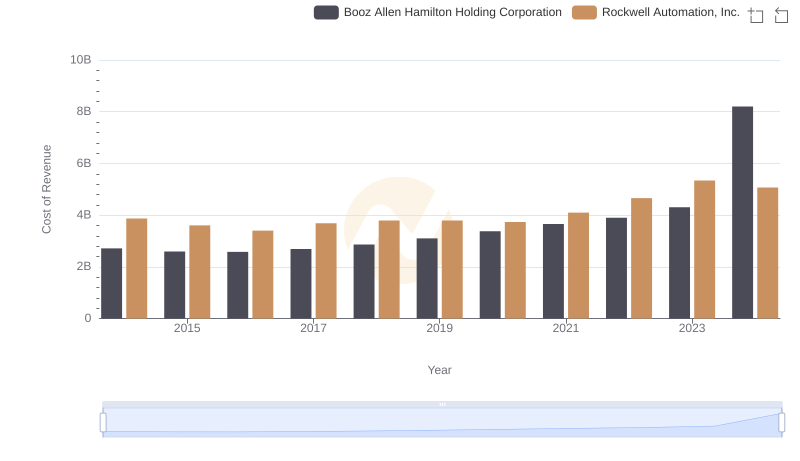
Rockwell Automation, Inc. vs Booz Allen Hamilton Holding Corporation: Efficiency in Cost of Revenue Explored
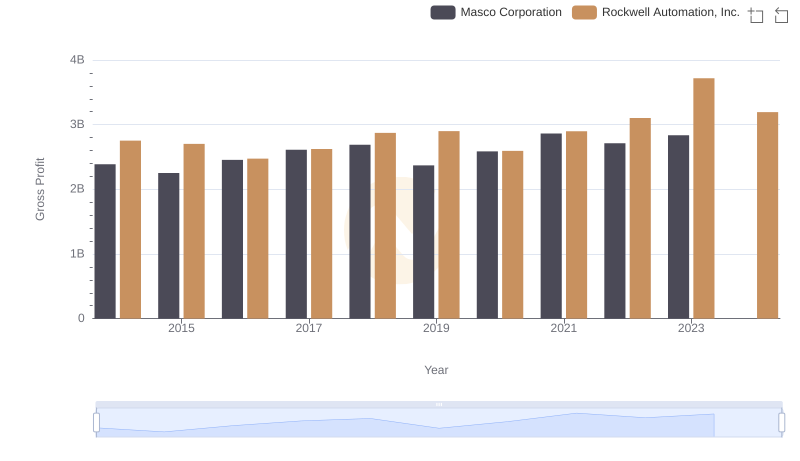
Gross Profit Trends Compared: Rockwell Automation, Inc. vs Masco Corporation
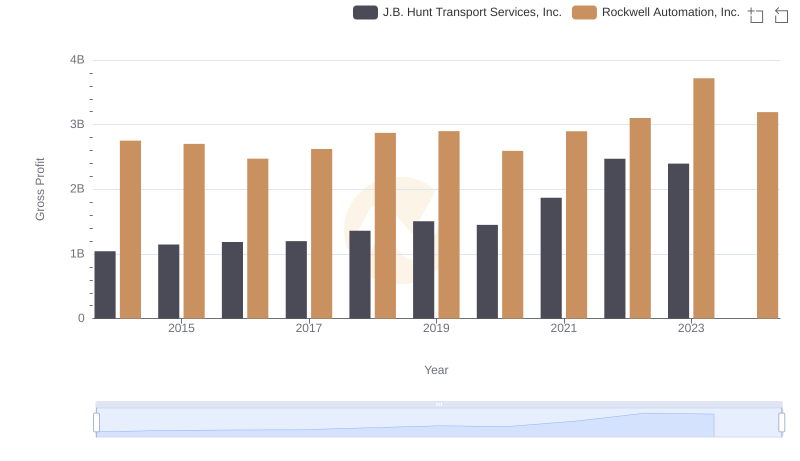
Key Insights on Gross Profit: Rockwell Automation, Inc. vs J.B. Hunt Transport Services, Inc.
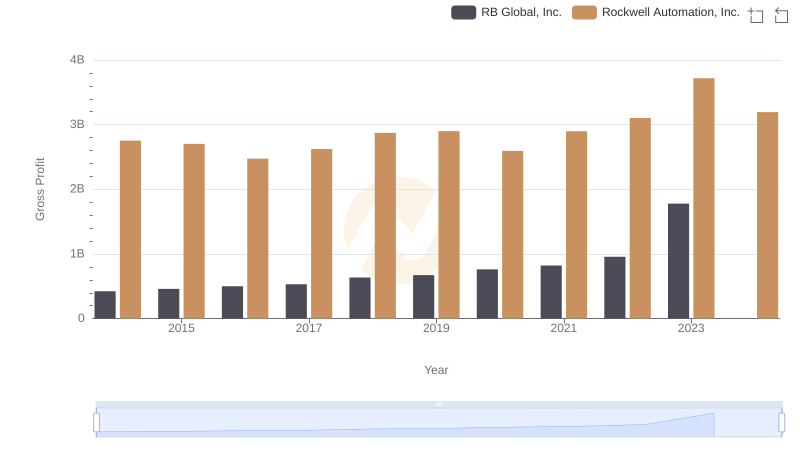
Gross Profit Trends Compared: Rockwell Automation, Inc. vs RB Global, Inc.
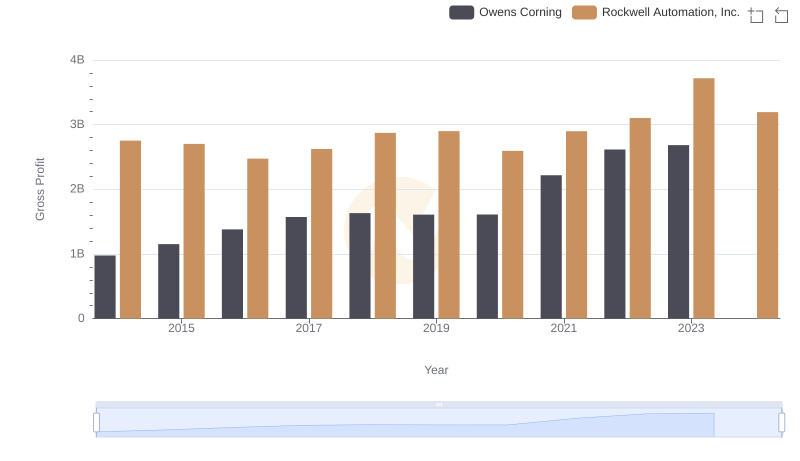
Gross Profit Trends Compared: Rockwell Automation, Inc. vs Owens Corning
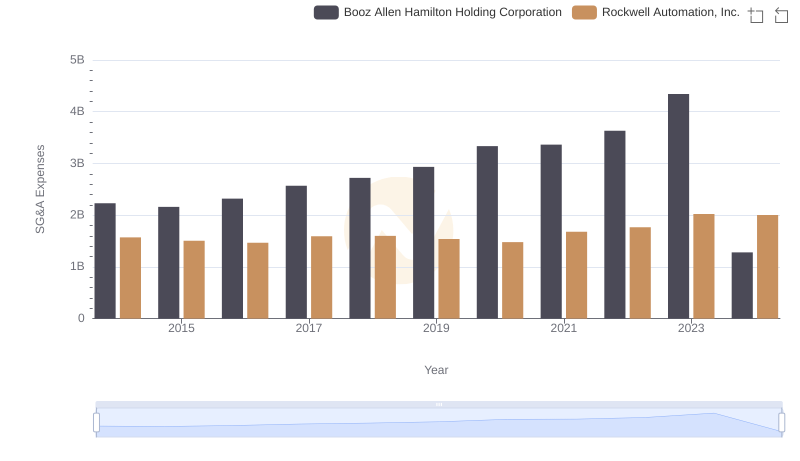
SG&A Efficiency Analysis: Comparing Rockwell Automation, Inc. and Booz Allen Hamilton Holding Corporation