| __timestamp | Booz Allen Hamilton Holding Corporation | Rockwell Automation, Inc. |
|---|---|---|
| Wednesday, January 1, 2014 | 2716113000 | 3869600000 |
| Thursday, January 1, 2015 | 2593849000 | 3604800000 |
| Friday, January 1, 2016 | 2580026000 | 3404000000 |
| Sunday, January 1, 2017 | 2691982000 | 3687100000 |
| Monday, January 1, 2018 | 2867103000 | 3793800000 |
| Tuesday, January 1, 2019 | 3100466000 | 3794700000 |
| Wednesday, January 1, 2020 | 3379180000 | 3734600000 |
| Friday, January 1, 2021 | 3657530000 | 4099700000 |
| Saturday, January 1, 2022 | 3899622000 | 4658400000 |
| Sunday, January 1, 2023 | 4304810000 | 5341000000 |
| Monday, January 1, 2024 | 8202847000 | 5070800000 |
Unleashing the power of data
In the ever-evolving landscape of corporate finance, understanding cost efficiency is paramount. This analysis delves into the cost of revenue trends for Rockwell Automation, Inc. and Booz Allen Hamilton Holding Corporation from 2014 to 2024. Over this decade, Rockwell Automation consistently maintained a higher cost of revenue, peaking at approximately $5.34 billion in 2023, reflecting a 38% increase from 2014. In contrast, Booz Allen Hamilton's cost of revenue surged dramatically by 2024, reaching $8.20 billion, a staggering 202% rise from its 2014 figures. This sharp increase in Booz Allen Hamilton's cost of revenue in 2024 suggests a strategic shift or expansion, warranting further exploration. The data highlights the dynamic nature of cost management strategies and their impact on financial performance, offering valuable insights for investors and industry analysts alike.
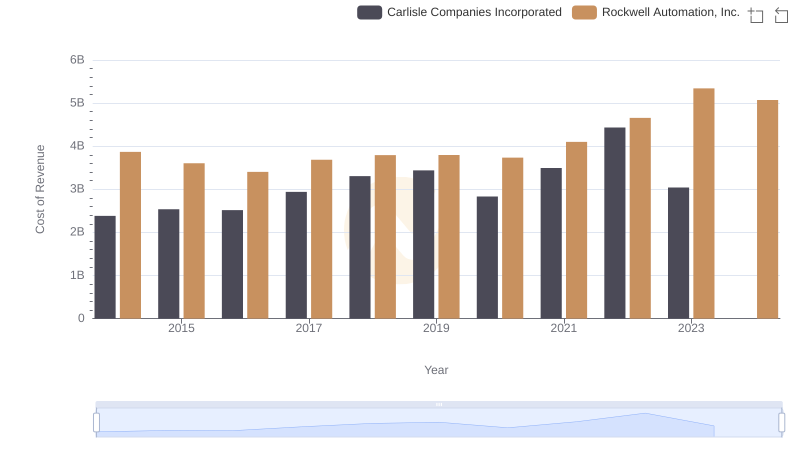
Cost of Revenue Trends: Rockwell Automation, Inc. vs Carlisle Companies Incorporated
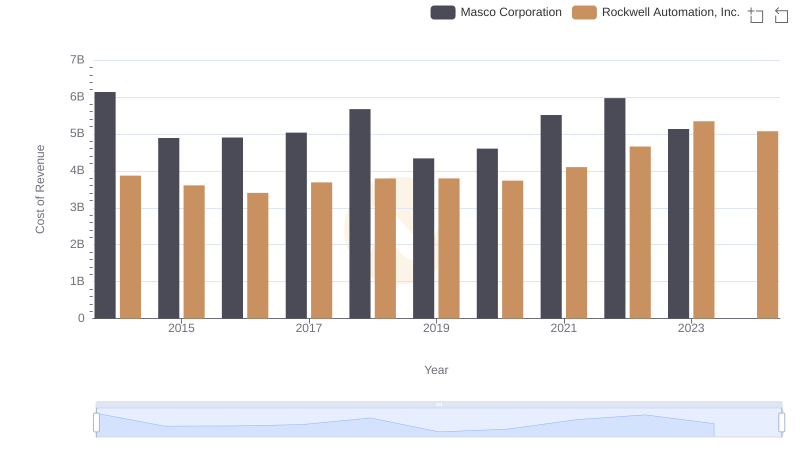
Analyzing Cost of Revenue: Rockwell Automation, Inc. and Masco Corporation
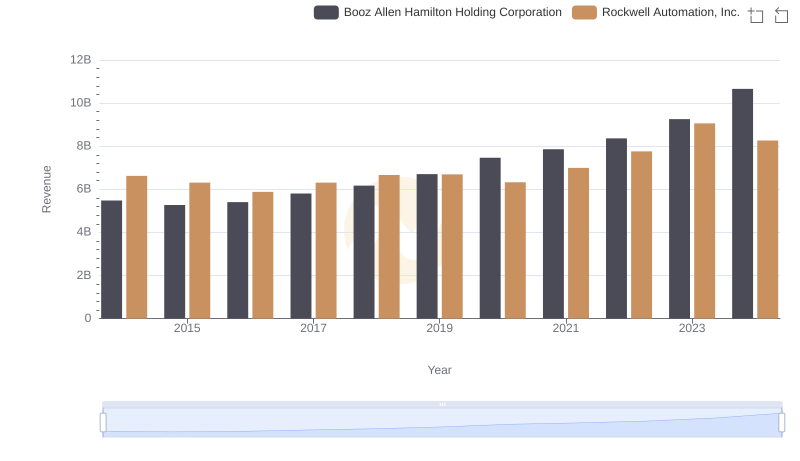
Breaking Down Revenue Trends: Rockwell Automation, Inc. vs Booz Allen Hamilton Holding Corporation
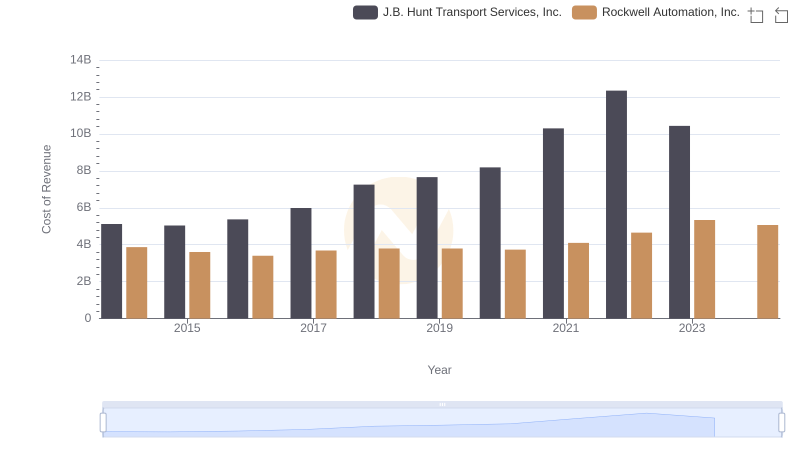
Analyzing Cost of Revenue: Rockwell Automation, Inc. and J.B. Hunt Transport Services, Inc.
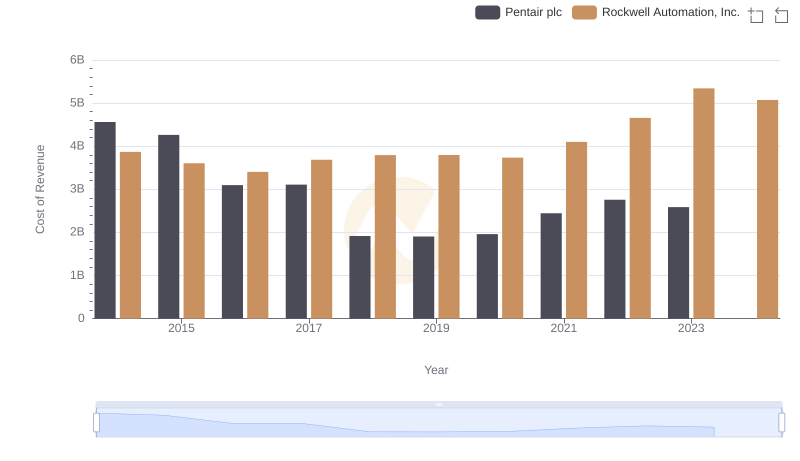
Cost of Revenue Trends: Rockwell Automation, Inc. vs Pentair plc
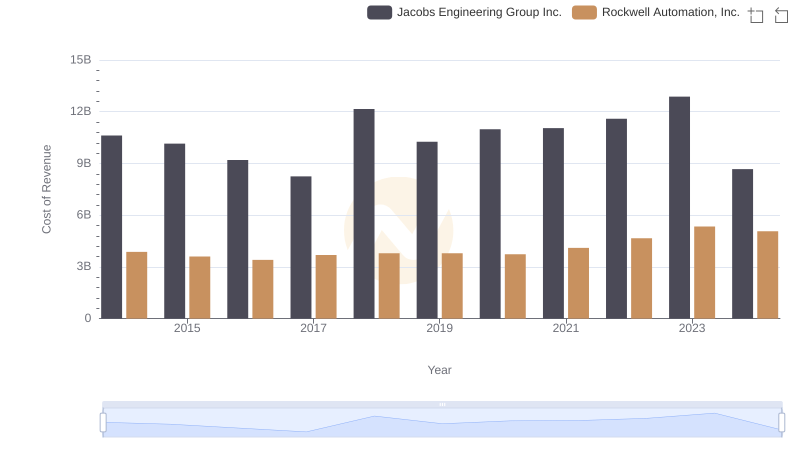
Cost of Revenue: Key Insights for Rockwell Automation, Inc. and Jacobs Engineering Group Inc.
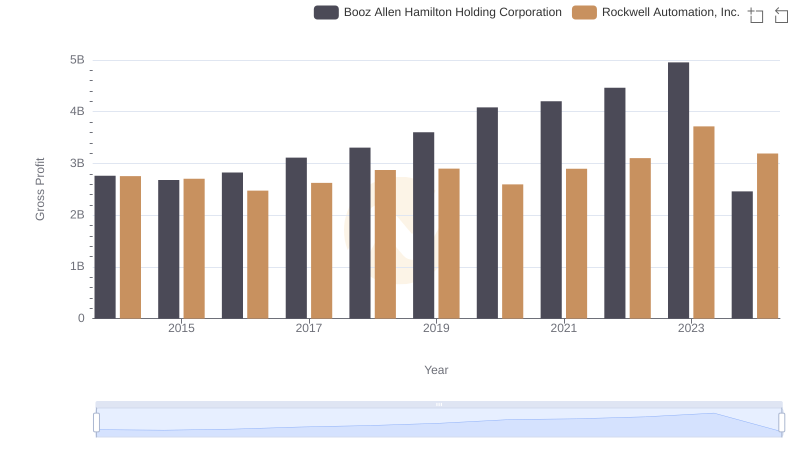
Gross Profit Trends Compared: Rockwell Automation, Inc. vs Booz Allen Hamilton Holding Corporation
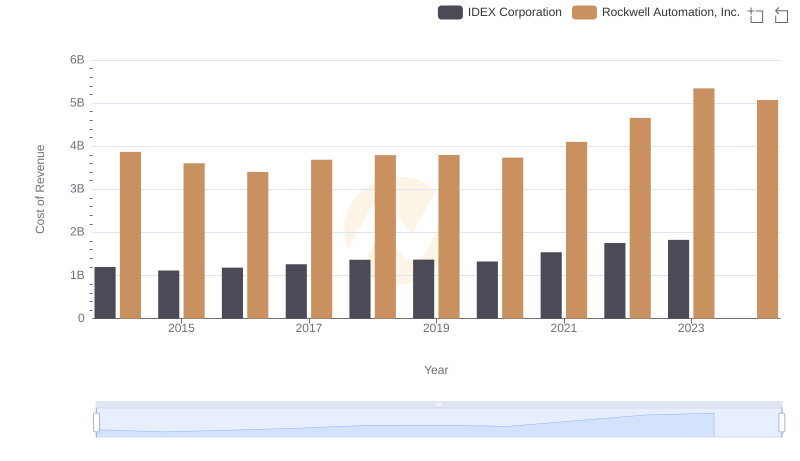
Cost Insights: Breaking Down Rockwell Automation, Inc. and IDEX Corporation's Expenses
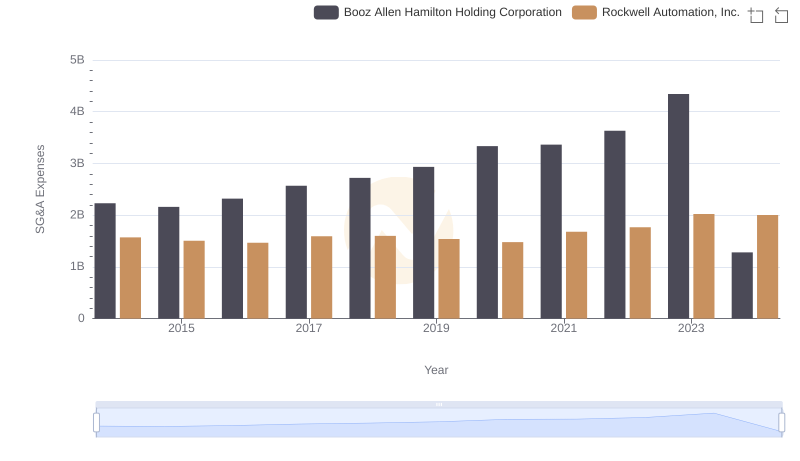
SG&A Efficiency Analysis: Comparing Rockwell Automation, Inc. and Booz Allen Hamilton Holding Corporation